
Two analysts pull the same annual report, apply what each calls a debt ratio formula, and publish figures that differ by a full turn. Which one got it wrong?
Usually neither. The label matched, the inputs didn't. One analyst counted only interest-bearing borrowings and divided by total assets, the other added lease liabilities and divided by earnings. Both can show their arithmetic. Both can defend it in a meeting.
That gap is where most financing arguments live. The headline formula is rarely the problem. What sits on top and what sits underneath is, and the fix is a documentation habit rather than a better equation.
Table of Contents
- Debt Leverage Ratio Formulas at a Glance
- Choosing the Right Debt and Denominator
- How to Calculate Each Ratio Step by Step
- Cash-Flow Leverage With Net Debt and Adjusted EBITDA
- Reading Leverage Results Against Benchmarks
- Document Your Inputs Before You Compare Ratios
Debt Leverage Ratio Formulas at a Glance
A debt ratio divides a company's debt by a measure of its size, its equity or its earnings. Change the denominator and you have changed the question, even though the spreadsheet label stays exactly the same.
Think about a household with a mortgage. The owners can ask how much of the property's value the loan funds, how the loan compares with the money they put in themselves, and how many years of salary it would take to clear the balance. Three answers, one debt. The first worries a lender about collateral, the second worries a creditor about the cushion behind the loan, and the third worries everyone about repayment capacity.
A company's balance sheet answers those same three questions, which is why analysts have built separate ratios for each one.
| Ratio | Formula | Question it answers |
|---|---|---|
| Gross leverage | Total debt ÷ total assets | How much of the asset base is financed by debt |
| Net leverage | (Total debt − cash) ÷ total assets | Asset financing after netting cash |
| Debt-to-equity | Total debt ÷ shareholders' equity | How large creditor claims are relative to owners' capital |
| Debt-to-capital | Total debt ÷ (total debt + shareholders' equity) | What share of invested capital comes from debt |
| Debt-to-EBITDA | Total debt ÷ EBITDA | How many years of operating earnings would be needed to repay debt |
| Net debt-to-adjusted EBITDA | (Total debt − cash) ÷ adjusted EBITDA | Borrowing capacity on a cash-flow basis |
The six formulas above are the ones you'll meet in filings, credit agreements and screening reports. Here they are in one view.
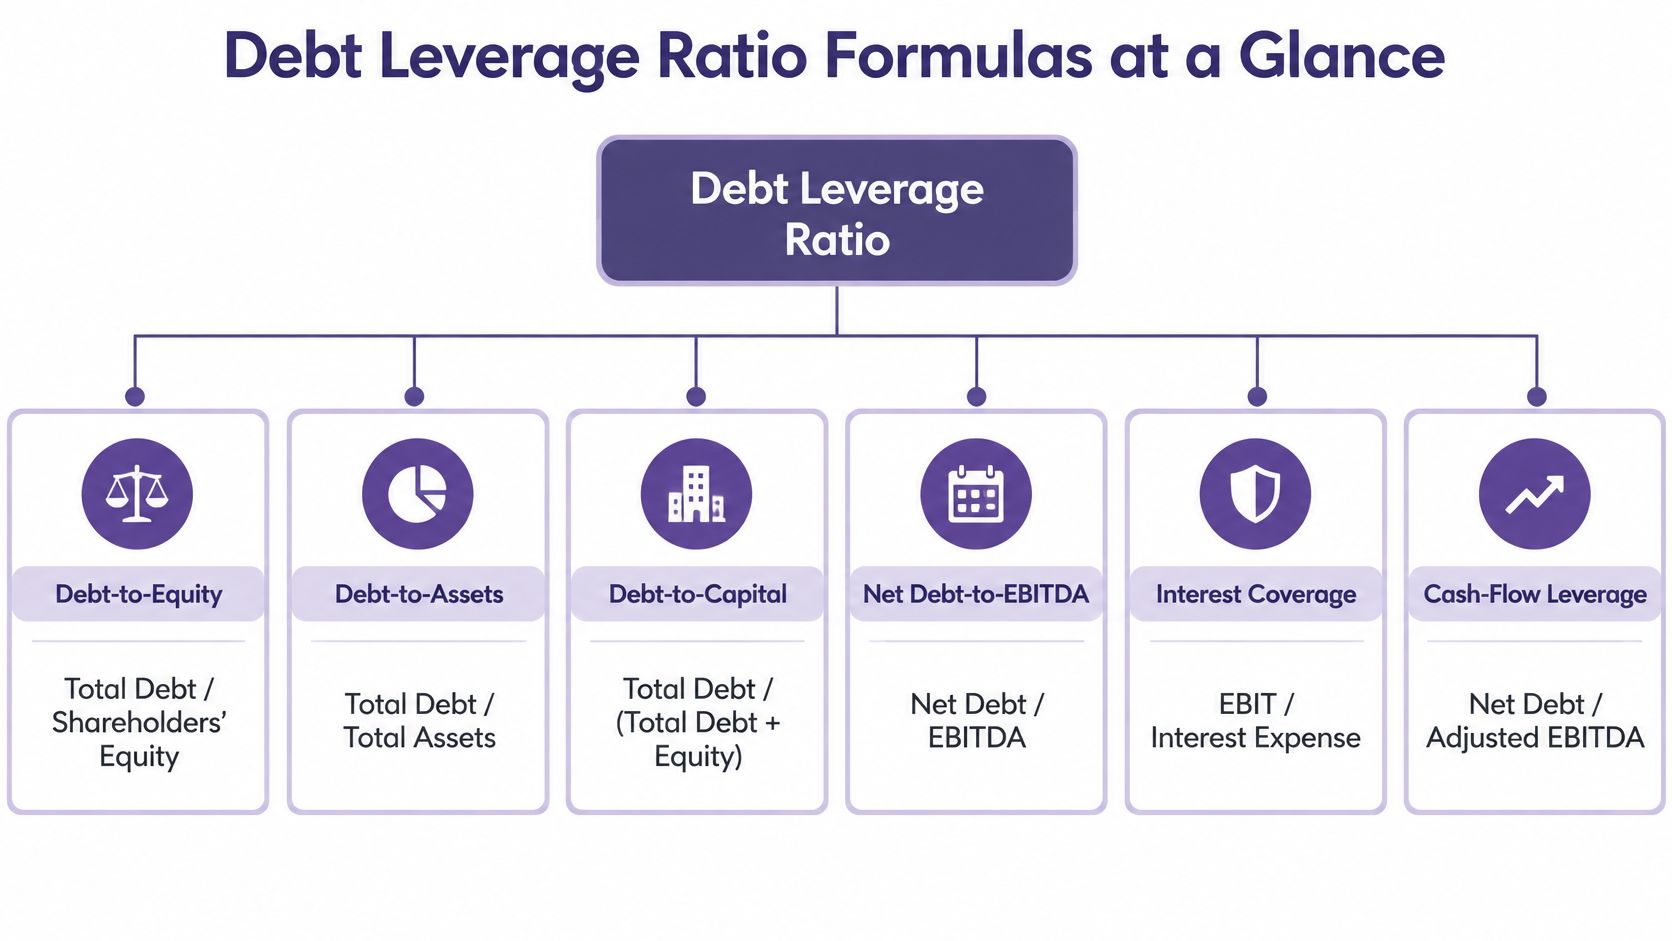
Most of these use total debt in the numerator, but not the same total debt, and the denominators run from total assets through equity to a year of operating earnings. Two of the six take a further step and subtract cash before dividing. That one adjustment lowers the result without changing a single contractual payment, which is why gross or net status has to travel with the number.
A leverage figure without its inputs is an opinion with a decimal point.
Run the same debt line against three denominators and you get three numbers: one a percentage of assets, one a multiple of equity, one a multiple of earnings. None of them is wrong. That's the trap.
Choosing the Right Debt and Denominator
A single balance sheet can produce three ratio figures before anyone touches a spreadsheet setting. Say a company reports $300 million of interest-bearing debt, $1 billion of total assets and $500 million of shareholders' equity. Debt-to-assets is 30% (300 ÷ 1,000). Debt-to-equity is 0.60x (300 ÷ 500). Debt-to-capital is 37.5% (300 ÷ 800).
The CFA Institute's financial ratio reference sets out all three measures and defines total debt as interest-bearing short- and long-term borrowings, excluding operating liabilities such as accrued expenses and accounts payable. Each ratio answers a different question: asset financing exposure, creditor claims against owners' capital, and the share of invested capital supplied by debt.
The household version of this comparison is the loan-to-value ratio, and how loan-to-value ratio is calculated follows the same discipline of naming the numerator and the denominator before comparing anything.
Banks fall outside this framework entirely. A bank funds its assets largely with deposits and other operating-type liabilities, so a debt-to-assets ratio built for a manufacturer says almost nothing about a bank's risk. Regulators measure bank strength against capital instead, and the European Banking Authority reported that the banking-sector capital ratio rose by 11 basis points to 5.8% in June 2024. Setting that beside a manufacturer's 60% debt-to-assets is a category error. The label has to say which framework produced the figure.
Five places the number moves
- Lease liabilities. Some calculations fold them into debt, others leave them as operating obligations. Both treatments appear in published research on the same company.
- Convertible debt. It can be counted as debt at face value, as debt at conversion value, or as equity once conversion looks likely.
- Minority interests. Whether they belong in the equity denominator changes debt-to-equity for any group with partially owned subsidiaries.
- Cash netting. Gross debt minus cash can cut a ratio sharply while contractual repayments stay untouched.
- Book versus market equity. A market-value denominator moves with the share price, so months with no new borrowing still produce a different figure.
Analysts who care about near-term obligations keep a current debt ratio formula separate from the long-term view, because the current portion of long-term debt is where refinancing risk lands.
Label first: Write the debt definition and the denominator beside every ratio before you put two companies next to each other.
A change from gross to net debt can materially lower the reported ratio without changing the obligations behind it. Keep the numerator as its own input so you can see which definition produced the score.
How to Calculate Each Ratio Step by Step
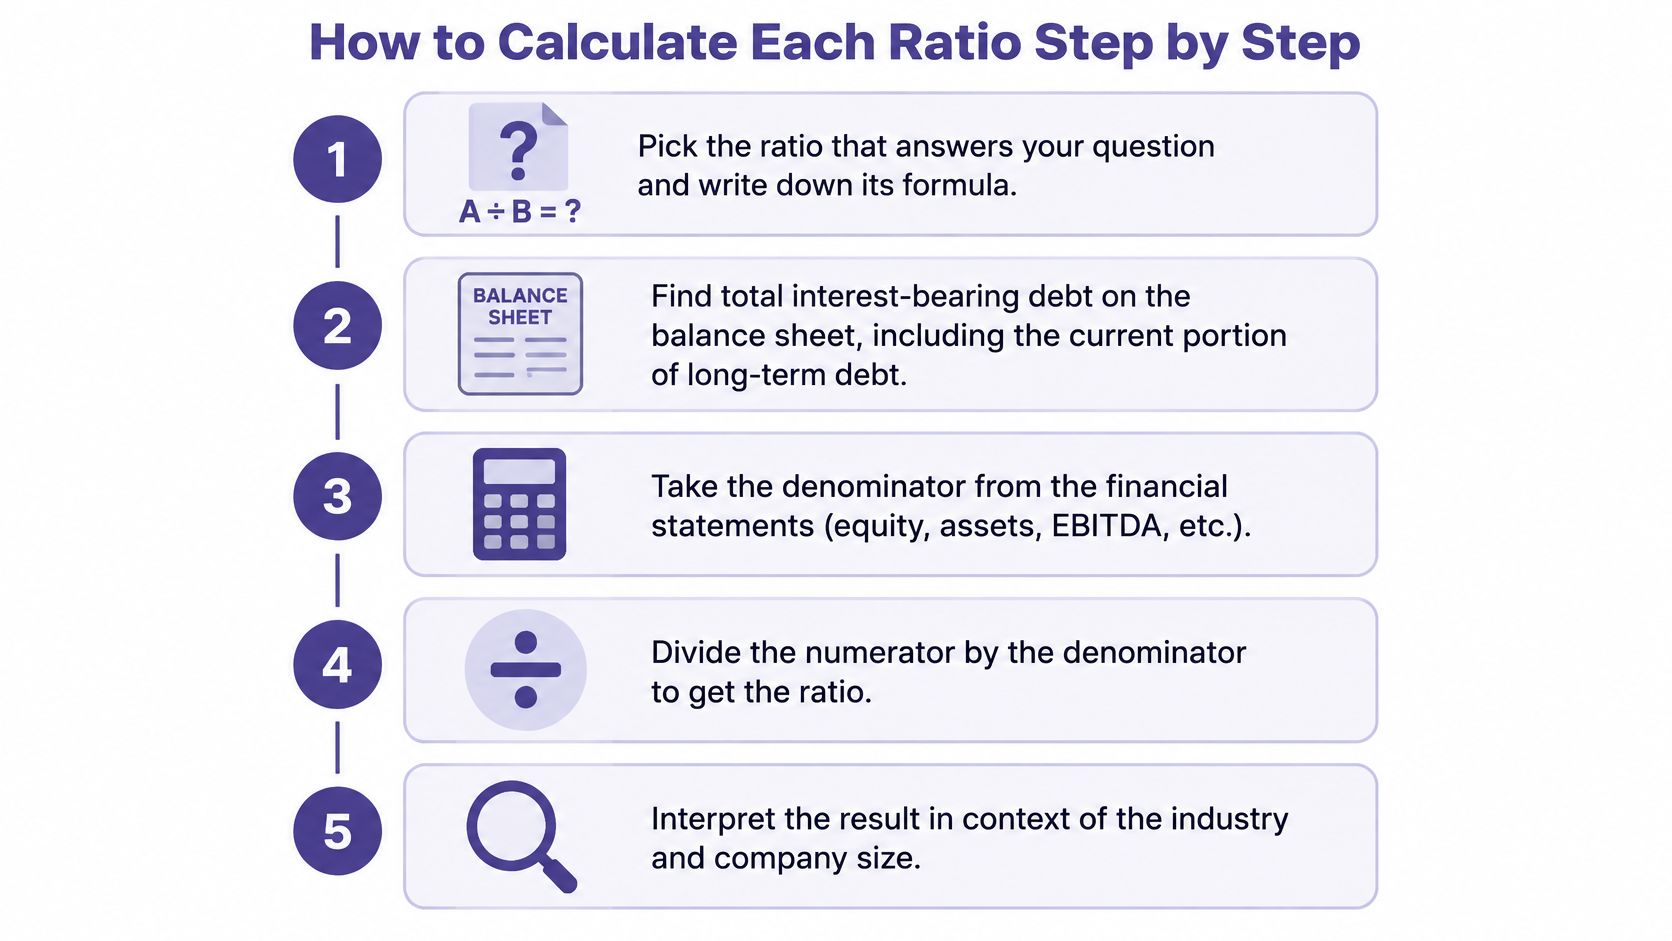
The sequence below works on any filing, in any sector, and it takes about ten minutes once you know where the lines sit.
- Pick the ratio that answers your question. Write the formula down before you open the document. Deciding what you're testing first stops you from choosing whichever denominator flatters the company.
- Find total interest-bearing debt. That's short-term borrowings, the current portion of long-term debt, and long-term debt from the balance sheet. Trade payables and accrued expenses stay out.
- Take the denominator from the same date or period. Assets and equity come from the balance sheet at the period end. EBITDA comes from the income statement for the same period. Pairing 2023 debt with 2021 equity produces a number nobody can use.
- Divide, and keep three decimal places before rounding. 600 ÷ 1,000 is 0.600, which reads as 60%. Rounding mid-calculation hides exactly the small differences you're trying to compare.
- Match the unit to the ratio. Asset ratios read as percentages, equity ratios and EBITDA ratios read as multiples. A 60% and a 1.5x describe the same company from different angles.
- Record the accounting basis and whether cash was netted. A ratio without that note can't be reused next quarter or compared with anyone else's.
Here is the full routine on a company with $600 million of debt, $1 billion of total assets, $400 million of equity and $100 million of EBITDA. The Federal Reserve's financial stability report sets out the same definitions and notes that its gross debt measure for publicly traded nonfinancial firms is an asset-weighted ratio of book-value total debt to book-value total assets, while its debt multiple uses debt divided by EBITDA.
| Ratio | Calculation | Result |
|---|---|---|
| Gross leverage | 600 ÷ 1,000 | 60% |
| Debt-to-equity | 600 ÷ 400 | 1.5x |
| Debt-to-EBITDA | 600 ÷ 100 | 6.0x |
| Net leverage | Needs the cash balance, which this example doesn't give | Not calculable from these inputs |
One balance sheet, three answers
The three results describe risk in three different ways, and none of them repeats another. Debt-to-assets speaks to balance-sheet solvency, the share of the asset base creditors effectively stand behind. Debt-to-equity measures the financing cushion available to those creditors if the company has to absorb losses. Debt-to-EBITDA approximates how many annual operating earnings periods would be needed to repay debt before interest, taxes, depreciation and amortization.
The net debt cell is the useful reminder. Four inputs were enough for three ratios and not enough for the fourth, because netting requires a cash figure that the balance sheet summary didn't include. A published table that shows 45% net debt ratio without exposing its cash line is asking you to trust a step you can't see.
Before you rely on any of it, recompute one ratio from the filing by hand and confirm it matches what your source published. If it doesn't match, you've found a definition difference, and that's the conversation worth having.
Cash-Flow Leverage With Net Debt and Adjusted EBITDA
Why do two analysts quote different cash-flow debt multiples for the same company? Earnings repay borrowings, and the asset pile does not, so credit analysts test capacity with a cash-flow version of the debt ratio. The diagram below shows the logic lenders apply when they test borrowing capacity.
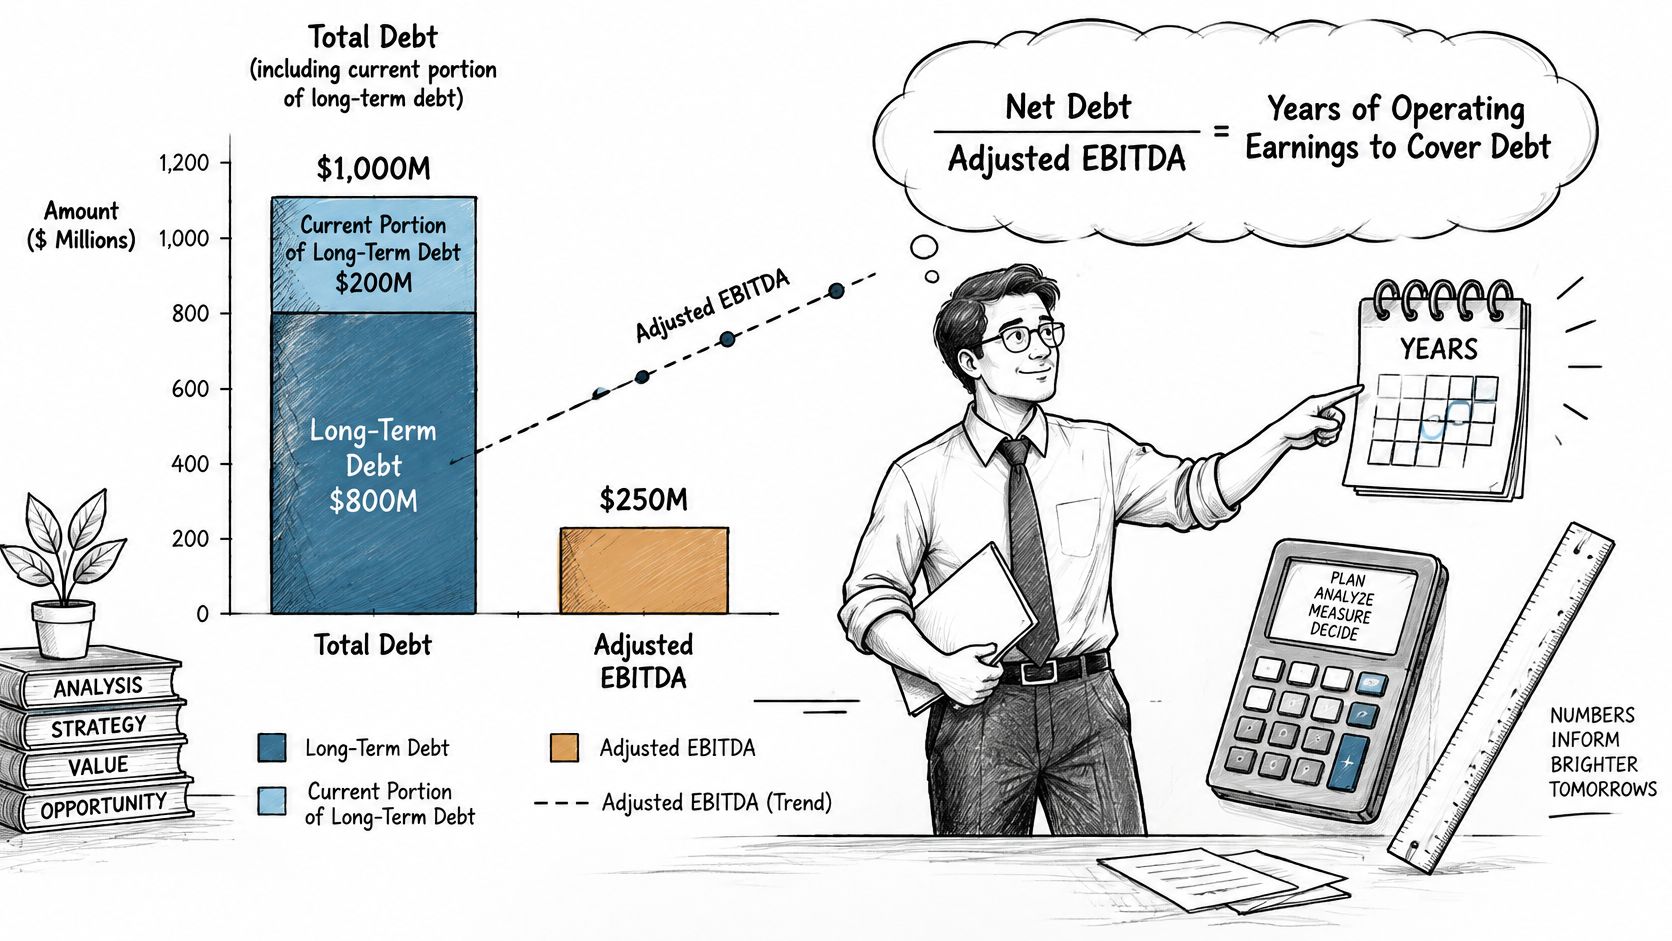
The arithmetic has three moves. Start with total debt, including the current portion. Subtract cash. Divide by adjusted EBITDA. A company reporting $540 million of debt, $140 million of cash and $200 million of adjusted EBITDA has net debt of 540 minus 140, or $400 million. Divide 400 by 200 and the net debt multiple is 2.0x, a measure SEC-filed company disclosures describe as one management and investors use to assess borrowing capacity.
Hold debt still and a larger adjusted EBITDA shrinks the ratio, which reads as more room to service debt. Hold EBITDA still and each extra dollar borrowed lifts the ratio. Anyone who uses the same inputs gets the same direction. The disagreement starts in the inputs.
Where the denominator gets judgmental
"Adjusted" EBITDA is a set of choices, not a line you can copy without the footnotes. Restructuring costs, stock-based compensation, acquisition-related expenses and one-off legal charges can all leave the denominator. Each exclusion raises EBITDA and makes the company look less indebted. Two analysts can open the same filing, build different EBITDA figures, and publish different debt ratios. The division can be perfect on both sides. They disagreed about what sits under the line.
The numerator has its own forks. Gross debt keeps the cash. Net debt subtracts it. Some agreements subtract only unrestricted cash, or cap how much cash may be netted. Change the top of the fraction and the multiple moves even when EBITDA does not.
Loan agreements then write their own version. Covenants carry bespoke add-backs, debt baskets and cash-netting rules, and the covenant figure is often the only one that triggers a consequence. Thresholds can step down over a loan's life, so the same balance sheet can pass in one year and fail in the next because the ceiling moved.
The EBITDA adjustments and common pitfalls guide is a useful reference for which add-backs recur across filings and why each one shifts the ratio.
Net debt and borrowing levels are often non-GAAP measures, and the definition changes by issuer. Before you compare two multiples, write four fields on one line: reported EBITDA, every adjustment, whether debt is gross or net, and the covenant definition if one exists. A single blended number throws those four away, so you cannot tell later whether a change came from the business or from the formula.
Reading Leverage Results Against Benchmarks
What does a "high" debt ratio mean? Very little, until you know which numerator and which denominator produced it, and which decade or industry you are reading it against.
No single cutoff travels cleanly. The same percentage can look cautious in one period and stretched in another, or ordinary for a utility and aggressive for a software firm. A fair reading is comparative, and the comparison only holds when both sides used the same inputs. Most disagreements between analysts start there, not in the arithmetic of a shared formula.
A Federal Reserve historical study reported that U.S. corporate debt-to-equity ratios clustered around 25% during 1957–1964 but around 44% during 1969–1975. That is a large rise in reliance on debt across a short span of years, on one definition. A fixed pass-or-fail line would have reclassified whole groups of firms even though the way the ratio was built had not changed.
Industry does the same job as time. A 60% debt-to-assets figure can mark higher risk for a stable, asset-light software business and sit inside the normal range for a capital-intensive utility or airline. The assets in the denominator are doing different work in each case. People arguing over the headline percentage are often arguing over what was counted on top and what was used underneath.
A three-step benchmarking routine
- Run at least five years on one definition. A ratio computed three different ways across five years measures your own inconsistency as much as the company's borrowing.
- Compare with peers using the same denominator. If your company's figure is debt-to-EBITDA and the peer median is debt-to-capital, you are ranking two different questions.
- Note the conditions when the ratio moved. A jump during a credit squeeze, a rate cycle or an acquisition wave says as much about the environment as about management.
Separating a genuine trend from a one-off matters just as much. If borrowing steps up in the quarter a company completes a large acquisition, treat that print as a new starting point and watch the next two filings before you conclude the business has become structurally more indebted. A steady climb across six quarters with no matching investment is a different story.
Screening rules make the denominator choice hard to skip. Shariah-compliant equity screening under AAOIFI compares interest-bearing debt with average market capitalisation over twelve quarters, against a 30% threshold. Because the divisor is a multi-year average, one day's price move does not rewrite the ratio. A long market decline can still tighten the test with no new borrowing, and a long rally can loosen it. Write the numerator (interest-bearing debt, not every liability) and the twelve-quarter window next to the result. Two people quoting "30%" without those labels are not quoting the same test.
A leverage ratio opens a line of inquiry. It rarely closes one.
The useful question is which inputs moved, and whether a peer's figure was built the same way.
Document Your Inputs Before You Compare Ratios
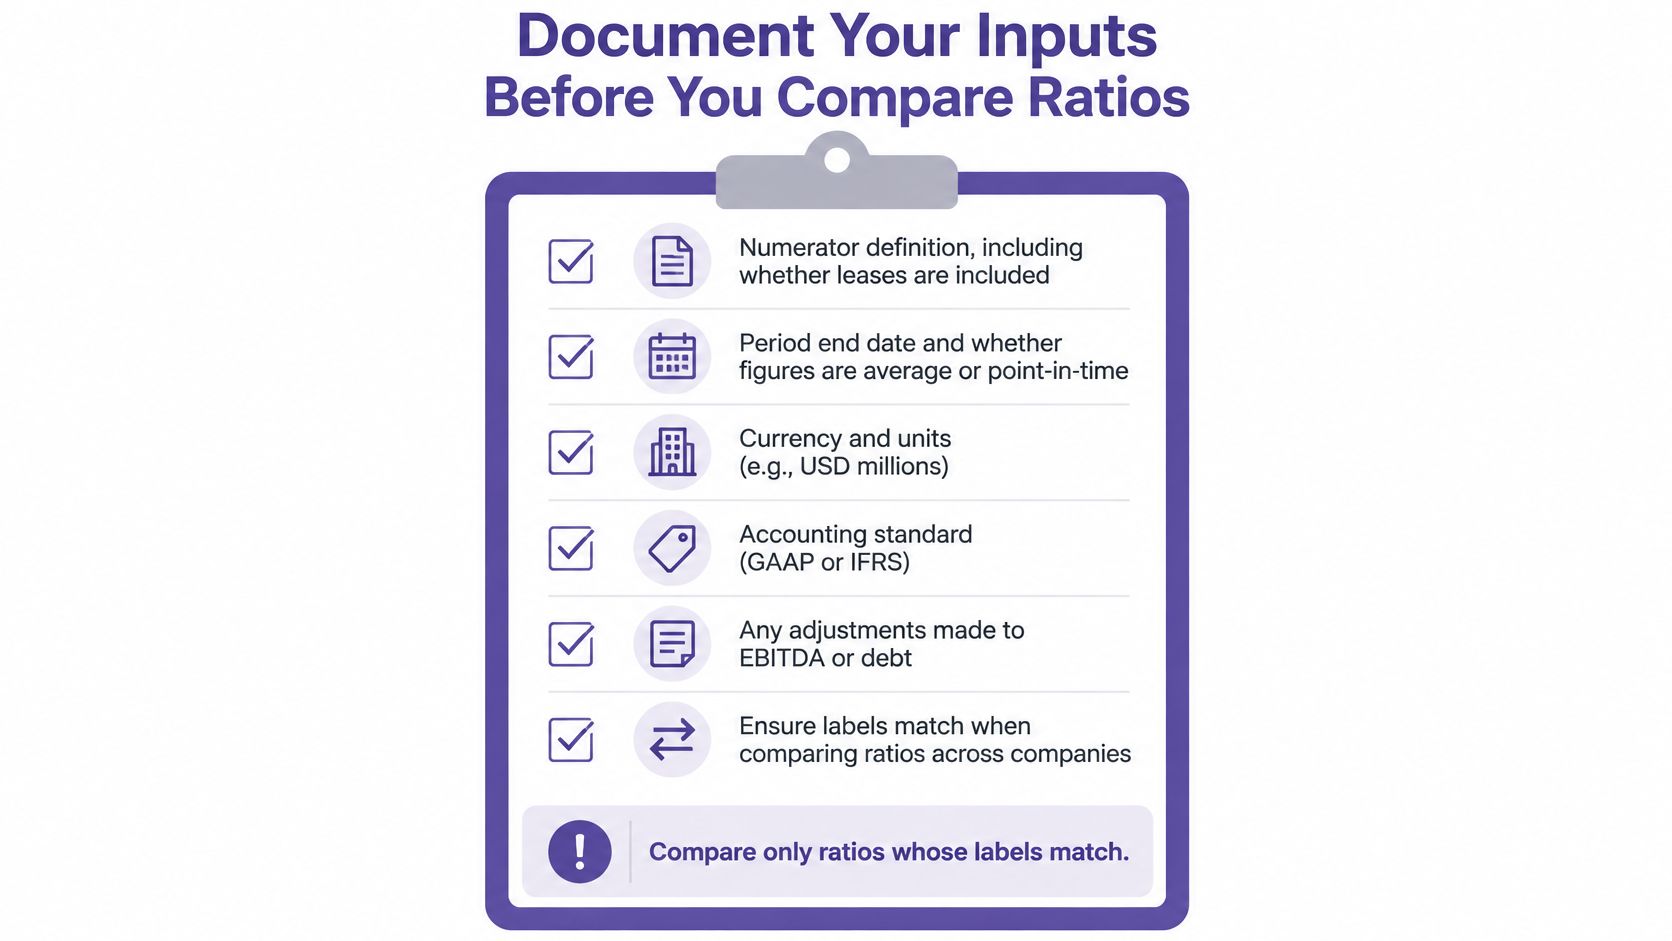
The fix for everything above is a one-page input sheet per company. Build it once, and compare only ratios whose labels match.
- Numerator definition. State whether leases, convertible debt and minority interests are counted, and at what value.
- Denominator and averaging period. Year-end assets, average equity and twelve-month EBITDA are three different divisors, so name the one you used.
- Accounting basis and cash treatment. GAAP or IFRS, and whether cash was netted from debt.
- Every EBITDA adjustment, itemised rather than netted into one number.
- Filing date and period end, so a stale figure can't pass as current.
- Covenant or lender definition whenever the ratio comes from a loan agreement rather than a set of accounts.
Rulebooks behave the same way. The Islamic Dow Jones Index methodology measures debt against its own denominator, and the index families each publish their own thresholds. A ratio built on one set of rules won't rank correctly against another's, which is why the label has to name the rulebook, not just the formula.
Debt inputs go stale quickly. Akinda updates financial ratios quarterly from each company's regulatory filings, which is the cadence a comparison sheet should match: refresh every input when the next filing lands instead of carrying a one-time score forward.
The single step worth taking this week: pick one company you follow, recompute its debt-to-EBITDA by hand from the latest filing, and check it against the figure on your sheet. If the two agree, you've validated a definition. If they don't, you've found the exact line where your calculation diverges from the source, which is worth more than the number itself.
Akinda computes debt, liquidity and impure-income ratios from each company's filings and returns them as ready-to-use decimals, with the underlying inputs exposed rather than folded into a single verdict. If you're building a halal investment app, a research dashboard or a broker product, that saves you from assembling the same figures across three different spreadsheets before you can screen anything. Visit Akinda to read the API documentation and try a request against a ticker you already follow.