
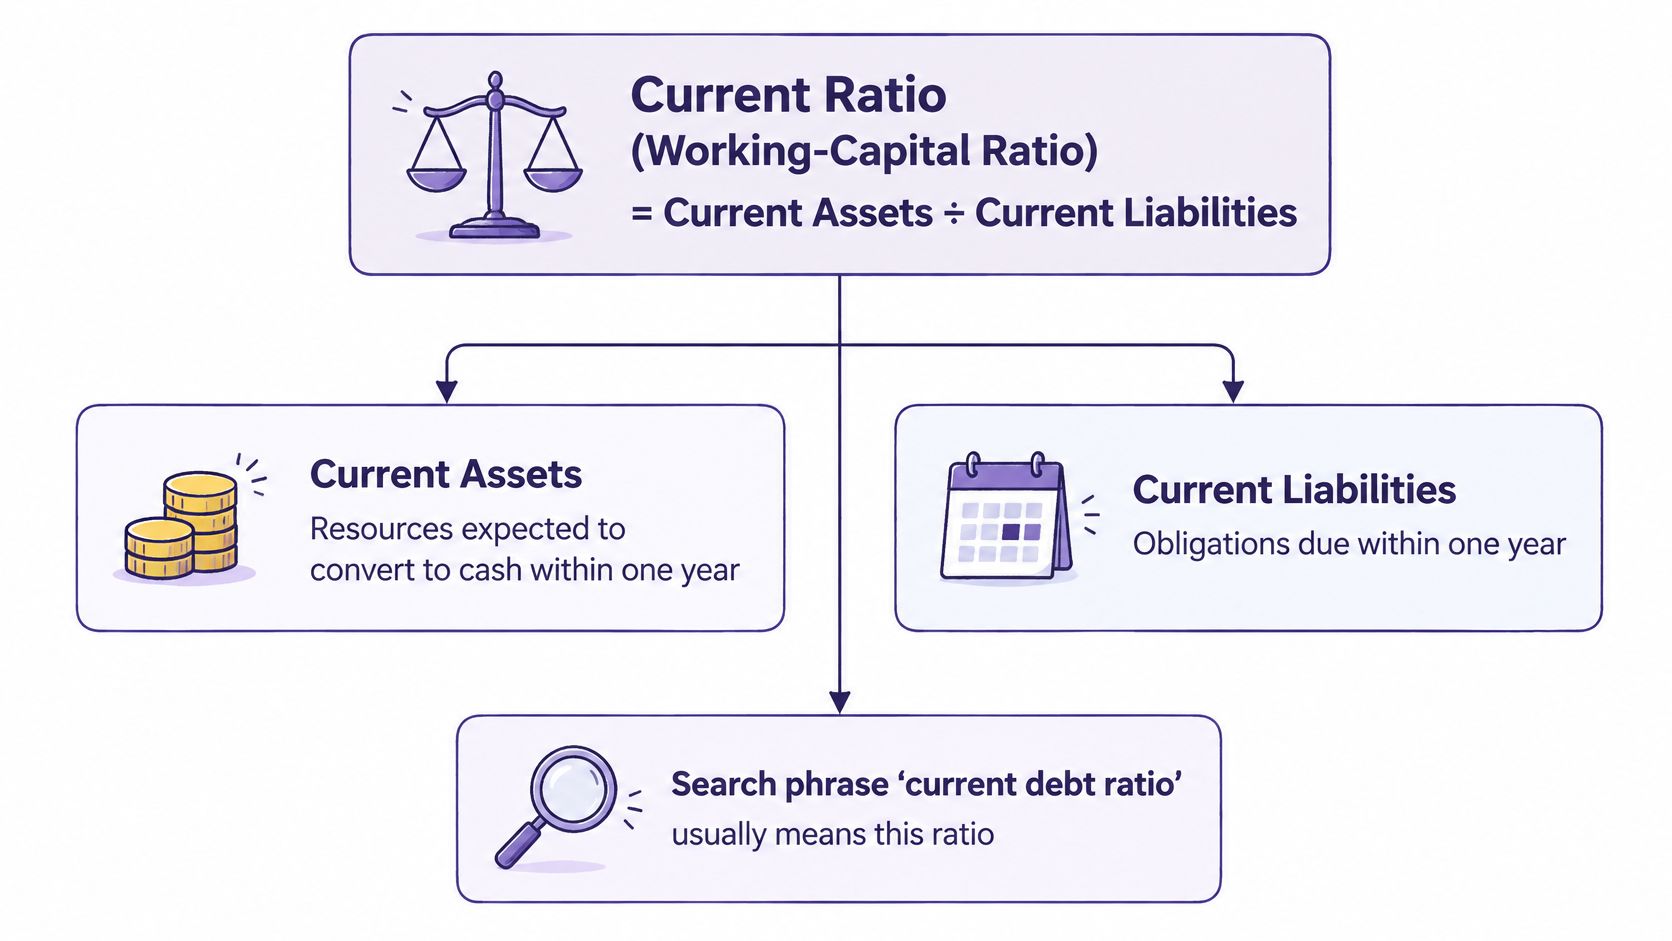
The current debt ratio formula most readers are looking for is the current ratio: current assets divided by current liabilities, both taken from the same balance-sheet date, with liabilities counted only where they fall due within about 12 months. A company with $240 million in current assets and $160 million in current liabilities lands at 1.50, which means $1.50 of current assets for every $1.00 due in the short term.
Now the awkward part. That same company can look liquid on one screen, strained on another and non-compliant on a third, all from a single balance sheet, because three separate ratios share the words debt and current.
Which one you need depends on the question you're asking, not on which formula you learned first.
Table of Contents
- The Current Debt Ratio Formula and Its Inputs
- How to Calculate the Ratio in Four Steps
- Reading Results Above and Below 1.0
- Why the Twelve-Month Window and Industry Change the Answer
- Leases and Other Liabilities That Change the Result
- Which Ratio Answers Your Decision
The Current Debt Ratio Formula and Its Inputs
Which debt counts as current? In the current ratio, the denominator covers all obligations due within about 12 months, including operating payables alongside short-term borrowing. That boundary separates it from two tests often pulled into the same search: debt-to-assets measures the proportion of debt to total assets, while a market-cap debt test compares interest-bearing debt with market value. The current debt ratio formula readers usually need is the liquidity measure: current ratio = current assets ÷ current liabilities. It is also called the working-capital ratio.
Current assets are cash plus resources expected to be collected, sold or consumed within about 12 months. Current liabilities are obligations due in the same window. Long-term borrowing can sit on both sides of that cutoff: the principal installment due this year is current, while later installments remain non-current.
| Input | What it includes | Where to find it |
|---|---|---|
| Current assets | Cash, accounts receivable, inventory, marketable securities, prepaid expenses | Current assets section of the balance sheet |
| Current liabilities | Accounts payable, accrued expenses, short-term loans, current portion of long-term debt | Current liabilities section of the balance sheet |
| Excluded from the denominator | Long-term debt due beyond 12 months | Non-current liabilities section of the balance sheet |
A bond or bank loan maturing in 2031 stays under non-current liabilities and out of the denominator unless part of its principal is already due in the coming year. Including the entire loan balance would measure broader debt exposure rather than near-term liquidity.
The ratio compares resources with obligations over the same short window. It leaves profitability, asset financing and borrowings maturing years later to other measures. The Xero guide to the current ratio defines the calculation the same way.
If the statement layout is still unfamiliar, understanding assets, liabilities, and equity from Bookkeeping and Accounting of Florida Inc. explains which accounts sit under each heading.
Pulling the lines from a filing rather than a printed statement is easier when the figures arrive as structured data. Akinda's API access to filing-derived figures supplies calculated ratios and extracted financial figures, keeping the check tied to reported data rather than a manual PDF transcription.
How to Calculate the Ratio in Four Steps
Four steps, run in this order, and the answer reproduces on any statement you pick up.
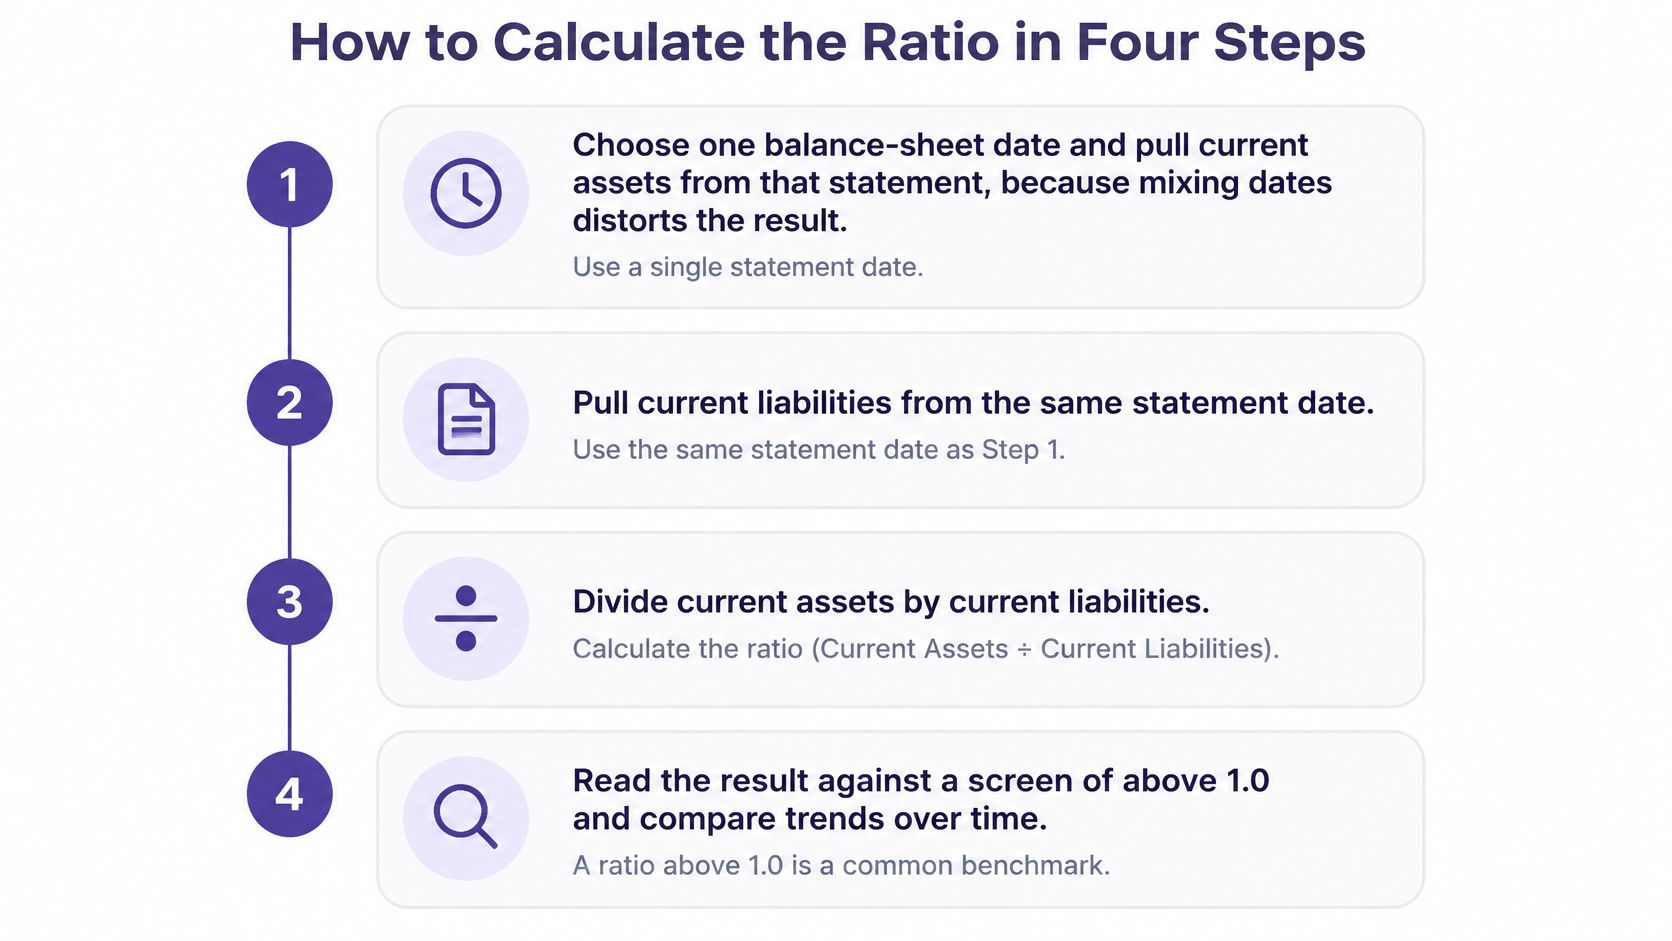
- Lock one balance-sheet date. Pull current assets from that single consolidated statement, because mixing a June inventory figure with a December payables figure produces a number that never existed on any reporting day.
- Take current liabilities from the same statement. Don't substitute total debt here. Total debt drags in long-term borrowing the ratio deliberately excludes, so the result stops being a liquidity measure.
- Divide and round to two decimals. The output is a multiple, not a percentage, and two decimals are enough to compare across periods.
- Check scale, currency and gaps. Confirm both lines use the same units and the same reporting currency, and record a missing input as unavailable rather than zero, since a gap in a filing shouldn't read as a clean bill of health.
Investopedia's definition of the current ratio adds two cautions worth keeping. A result above 1.0 doesn't prove solvency, because inventory and receivables may be slow to convert into cash, and a very high figure can just mean idle working capital. It also recommends labeling a separate debt ratio explicitly as total debt ÷ total assets, since changing the denominator changes what the number means.
Take a distributor reporting $180 million in current assets and $150 million in current liabilities on one filing date. Steps one and two give both lines, step three gives 1.20, and step four confirms no currency mismatch. The same four steps on the 1.50 company above return the same shape of answer, just with more headroom.
Then test yourself. Recalculate on an earlier balance-sheet date and check whether the direction of change matches what management said happened. If receivables jumped but revenue didn't, the ratio improved for a reason that won't repeat.
Reading Results Above and Below 1.0
Once the number exists, the reading is mechanical at first. Above 1.0, recorded current assets cover near-term obligations. Below 1.0, short-term obligations exceed current assets. Exactly 1.0 is the tight case: coverage is exact on paper, with no margin if sales slow or a large customer pays late.
| Result | What it signals | What to check next |
|---|---|---|
| Below 1.0 | Short-term obligations exceed current assets | Timing of cash inflows, available credit lines, receivables quality |
| Exactly 1.0 | Current assets equal current liabilities with no margin | Whether inventory and receivables convert to cash on schedule |
| Above 1.0 | Current assets cover near-term obligations | Whether the assets are truly liquid or capital is sitting idle |
| Well above peers | Possible idle working capital | Comparison with industry peers over several reporting periods |
The trap sits at the top of that table. A high ratio feels reassuring and often isn't. Receivables may be aging past 90 days, inventory may be the wrong product for the current season, and cash sitting still earns nothing while the business pays interest elsewhere.
Practical rule: a current ratio is only as strong as the assets behind it. Compare the same company across three reporting periods and two or three peers before you conclude anything.
Liquidity is also only one lens. When the question is whether a company can service the cost of its borrowing rather than pay this quarter's bills, interest cover in UK due diligence from Lighthouse Consultants shows how that second test is built and where it departs from a balance-sheet ratio.
If the ratio is feeding a compliance workflow instead of a credit file, Shariah-compliant screening applies a different set of thresholds and a different denominator, and mixing the two produces verdicts nobody can defend.
Why the Twelve-Month Window and Industry Change the Answer
The one-year boundary is a default, not a law of nature, and accounting standards say so out loud. Current assets are expected to be realized, sold or consumed within 12 months, and current liabilities are obligations payable in the same period.
Under the IAS 1 classification approach, when a company's normal operating cycle can't be clearly identified, a 12-month period is used as the fallback. The Investopedia note on short-term debt sets out that boundary and adds the illustration: a retailer holding $90 million across cash, receivables, inventory and other current assets against $100 million in current liabilities reports 0.90, a nominal $10 million shortfall in current-asset coverage.
U.S. guidance handles the edge case differently. Where the operating cycle runs longer than a year, that longer cycle is used, which matters for construction, shipbuilding, infrastructure and specialty manufacturers whose projects span several years.
Sector then reshapes the meaning of an identical number. Inventory-heavy businesses can report above 1.0 while still depending on timely stock sales to stay there. Subscription and service businesses can operate safely with little inventory and a lower ratio, because cash arrives monthly and there's nothing to mark down.
Before comparing two companies, confirm three things:
- The reporting standard, because IAS 1 and U.S. practice treat long operating cycles differently.
- The length of the operating cycle, since a shipbuilder and a grocer aren't running the same clock.
- The classification of the current portion of debt, because where that slice sits changes the denominator.
A fair comparison needs matching windows and matching classification policies, not just the same formula typed twice.
Leases and Other Liabilities That Change the Result
Here's the assumption worth challenging: not every current liability is debt. Accounts payable, taxes and accrued expenses are operating obligations rather than borrowed funds under many definitions, so a "current debt" version that sweeps them in stops being a debt measure.
Leases are the harder case. Current liabilities can include current operating-lease and finance-lease liabilities under modern presentation, and whether an operating lease counts as debt depends on the definition used in the analysis or the contract. NYU Stern's corporate finance definitions page notes that operating leases may be treated as debt for analytical purposes by discounting future commitments, and an illustrative case shows lease liabilities pulling the current ratio from 1.00x down to 0.97x.
Two-version habit: report a contractual-debt version and an adjusted version that includes lease liabilities, and label which policy produced each number.
The label matters more than the choice. Two companies can report different ratios purely because one capitalizes leases and the other doesn't, and that gap will look like a liquidity difference to anyone reading the output cold. Confirm both sides used the same policy before drawing a conclusion.
There's a data-quality angle too. Converting undisclosed lease figures into zero manufactures comparability that doesn't exist, which is why a missing input should stay null in any automated pipeline rather than becoming a clean 0.00.
Which Ratio Answers Your Decision
The mix-up has a simple shape. The current ratio asks whether short-term obligations can be met from current assets. Total debt divided by total assets asks how much of the asset base is funded by borrowing. They aren't substitutes, and one can't stand in for the other in a spreadsheet.
The Federal Reserve's borrowing report shows the second measure at work: gross debt load, defined as the ratio of debt to assets, for publicly traded nonfinancial firms remained high in the second quarter of 2024, although below pandemic-era record levels. That's a borrowing statement about a whole sector, not a liquidity verdict on any one company.
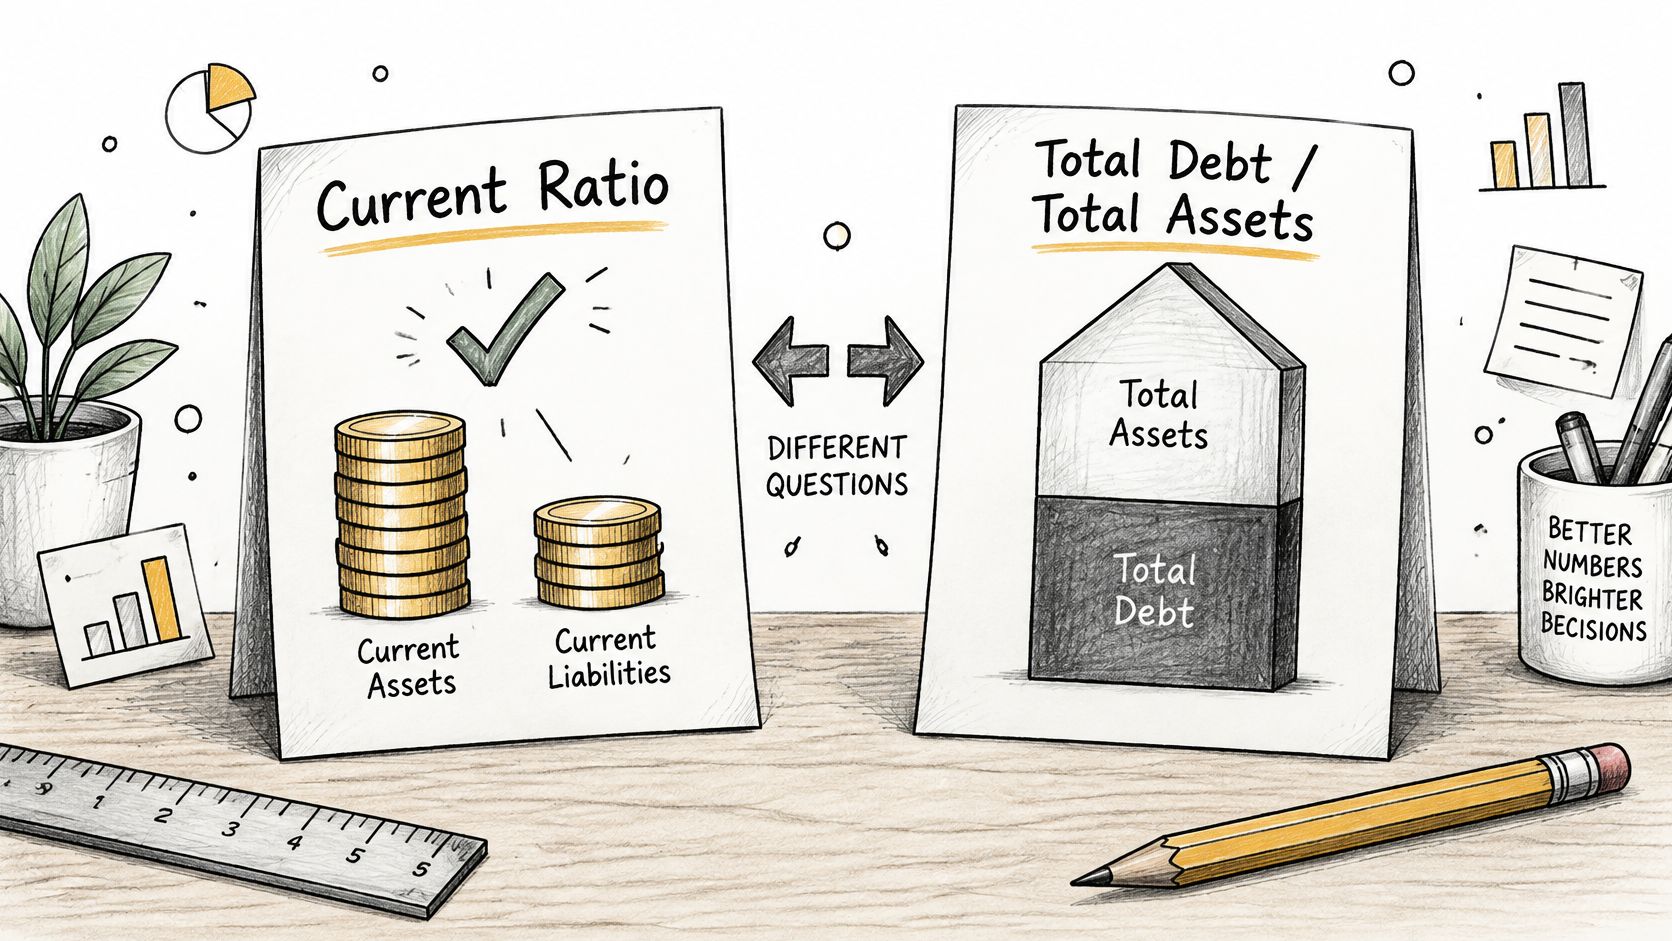
| Ratio | Formula | Question it answers | Typical threshold |
|---|---|---|---|
| Current ratio | Current assets ÷ current liabilities | Can short-term obligations be met from current assets? | Above 1.0 |
| Total debt ratio | Total debt ÷ total assets | How much of the asset base is funded by debt? | No fixed cutoff; set by the lender, sector or mandate |
| AAOIFI debt test | Interest-bearing debt ÷ market capitalization | Does debt exceed a set share of market value for Shariah screening? | 30% maximum |
A third test enters when you're screening a stock for Shariah compliance, and it isn't the current ratio at all. For AAOIFI Shariah Standard No. 21-style equity screening, the debt test is interest-bearing debt ÷ market capitalization, with a commonly cited maximum of 30%, as Purindex's comparison of screening standards sets out. Because the denominator is market-based, the verdict moves with the share price: a company passes when its debt is unchanged but its market capitalization rises, and fails when the market value falls without a dollar of new borrowing. Other methodologies use different bases and averaging periods, with S&P and Dow Jones sometimes applying longer market-cap averages and MSCI or FTSE frameworks using asset-based tests.
Match the ratio to the question in front of you:
- Paying this year's bills? Use the current ratio built from current assets and current liabilities on one statement date.
- Funding structure? Use total debt ÷ total assets, and name it that way in the output.
- Screening a stock for a Shariah mandate? Use the AAOIFI debt test on market capitalization, with the market-cap date or averaging window disclosed.
If you want the liquidity side worked through in more depth before you pick a denominator, this guide to finding the liquidity ratio covers how the inputs behave across filings and why the window matters. Screening results are informational, based on reported financial data, and don't replace a qualified scholar's ruling.
Today's action is one balance sheet. Compute the current ratio for a single reporting date, check the operating-cycle and lease policy behind it, compare the result with two or three peers over the same period, and note which of the three formulas your decision needs. Leave the other two out.
Run the numbers on one ticker you already follow before you wire anything into a pipeline. Akinda's Financial Ratios basic report returns the debt, liquidity and impure income ratios from the latest filings as ready-to-use decimals, and its debt ratio analysis measures interest-bearing debt against the 12-quarter average market capitalization with the strict AAOIFI 30% threshold applied. Visit Akinda to pull a basic report and see which ratio each verdict is built on.