
You're looking at a company's balance sheet, probably late in a screening process, and you need one answer before you move on. Can this business pay the bills that come due in the next year without scrambling for cash? That's what learning How to Find Liquidity Ratio figures really gives you. Not a verdict on long-term health, not a profitability score. Just a dated, traceable check on short-term coverage.
The trap is treating the first number you calculate as the answer. A company can report plenty of current assets and still struggle to pay on time if those assets are overdue receivables, inventory that won't sell, or cash it can't touch. This guide walks you through pulling the right lines, running three related ratios, and reconciling the result before you act on it.
Table of Contents
- Liquidity Ratio Formulas You Need Before You Start
- How to Pull the Right Numbers From a Balance Sheet
- Worked Example Calculating Each Ratio Step by Step
- Reading Ratios Against Time, Peers and Common Errors
- Checking a Healthy Ratio Before You Act On It
Liquidity Ratio Formulas You Need Before You Start
Many readers searching for a liquidity ratio want the current ratio first. In practice, "liquidity ratio" usually means one of three balance-sheet ratios, and they all ask the same question with different strictness. Can assets expected to turn into cash soon cover obligations due soon?
Every input comes from the balance sheet, not the income statement. That matters more than most beginners expect. The income statement covers a period, while the balance sheet is a snapshot on one date, so your numerator and denominator must come from that same date or the division means nothing.
The Three Ratios and One Cushion
Start with the current ratio for a general first check. Move to the quick ratio when inventory is large, slow-moving, or hard to value, because it tests coverage without assuming you'll sell stock at full price. Use the cash ratio for stressed companies, distressed situations, and financial firms where only cash on hand really counts.
Working capital sits alongside them, but it's not a ratio. It's a currency amount, so it tells you the size of the cushion in dollars rather than as a multiple.
| Ratio | Formula | Numerator includes | Best used when |
|---|---|---|---|
| Current ratio | Current assets ÷ Current liabilities | All current assets, including inventory and prepaid expenses | General first check of short-term coverage |
| Quick ratio | (Current assets − Inventory − Prepaid expenses) ÷ Current liabilities | Cash, marketable securities and collectible receivables | Inventory is large, slow or hard to sell |
| Cash ratio | (Cash + Cash equivalents) ÷ Current liabilities | Cash and cash equivalents only | Stress tests, distressed companies, banks and financial firms |
| Working capital | Current assets − Current liabilities | Dollar amount, not a ratio | Sizing the cash cushion in currency units |
Practical rule: If the three ratios tell very different stories, don't average them. The gap itself is the finding, and it usually points to inventory or receivables.
Notice what changes across the rows. The denominator, current liabilities, stays the same. Only the numerator gets stricter. That single design choice is why the choice of ratio can change your conclusion about the same company on the same day.
How to Pull the Right Numbers From a Balance Sheet
The sequence below keeps you from pulling a clean-looking number off the wrong page. Follow it in order, because each step protects the next one.
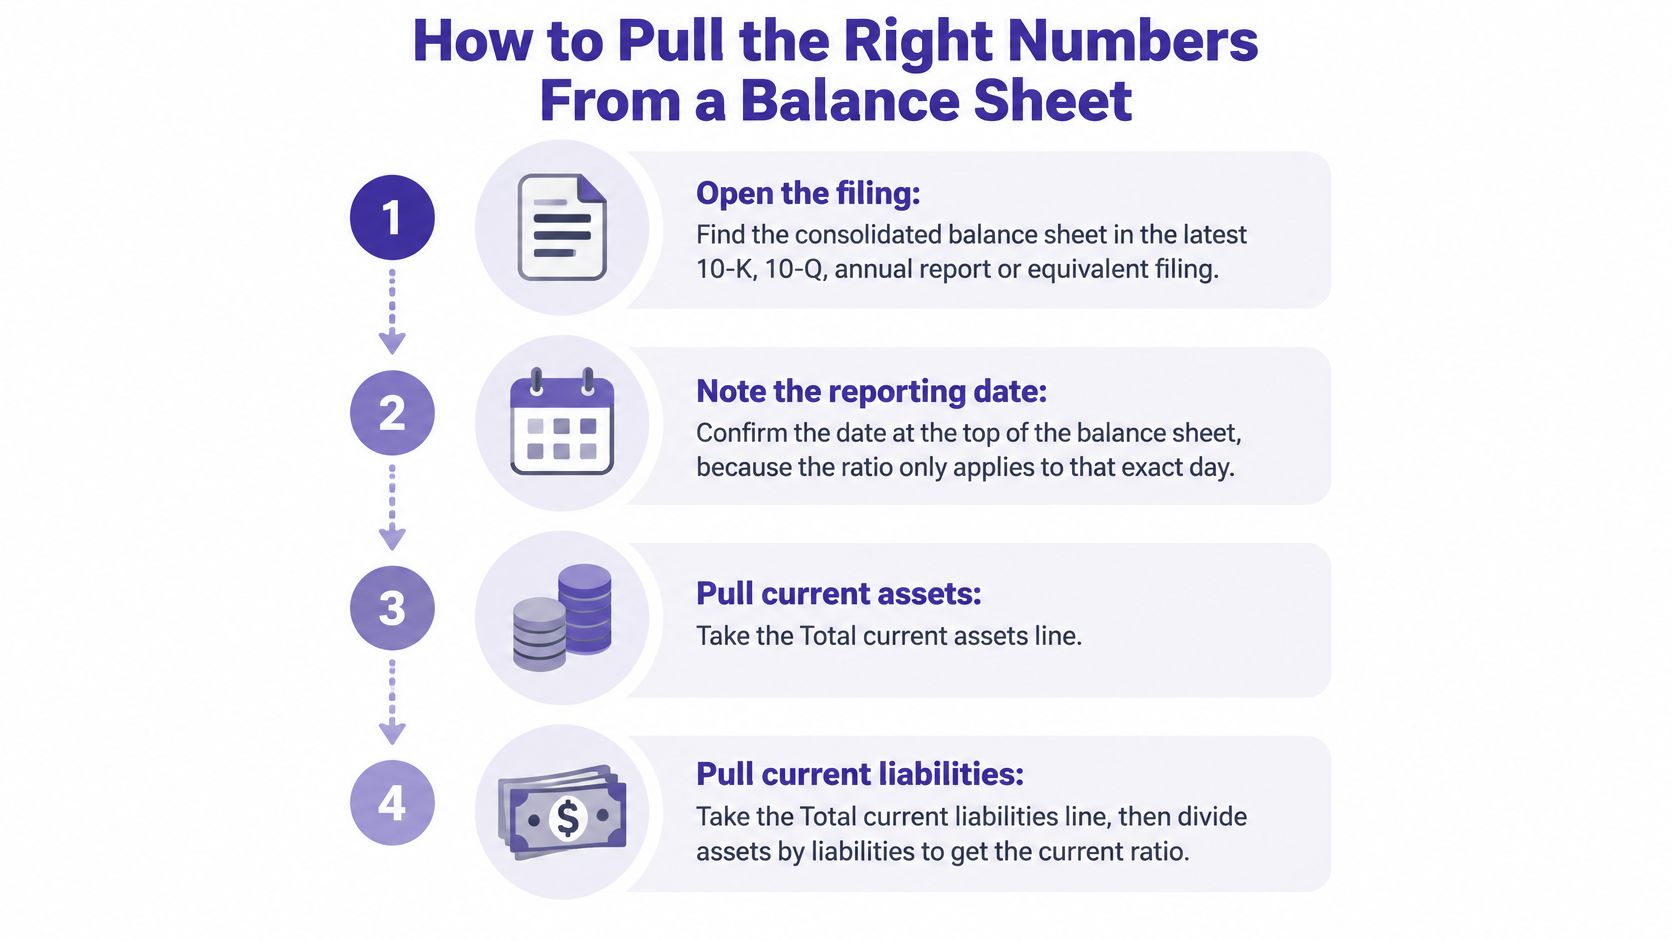
The visual summary gives you the short version before the detailed steps.
Step by Step Through the Filing
Open the most recent filing. Find the consolidated balance sheet in the latest 10-K, 10-Q, annual report, or equivalent. You can search the company name on SEC EDGAR to open its filings directly.
Note the date and currency. Write down the balance-sheet date and reporting currency first. A mismatch here breaks every ratio you'll calculate afterward, and you won't notice it unless you check.
Find total current assets. This is the subtotal for items expected to convert to cash within 12 months. The SEC beginner's guide to financial statements defines current assets using that 12-month conversion horizon and identifies cash, receivables, and inventory as standard examples.
Record the components separately. List cash and cash equivalents, marketable securities, trade receivables, inventory, and prepaid expenses as individual lines. You'll need them split out for the quick and cash ratios, so don't just copy the subtotal.
Find total current liabilities. Then check whether the current portion of long-term debt and lease liabilities are included in that line. If they're presented separately, they still belong in your denominator.
Read the footnotes before you divide. Look for restricted cash, receivable allowances, supplier-finance programmes, and debt reclassifications. These notes don't change the arithmetic, but they change what your inputs really mean.
Document everything next to the date. Write the numerator and denominator line items beside the filing date, units, and any adjustments you made. That habit makes your calculation reproducible when someone reviews it later.
For non-US issuers reporting under IFRS, look for the statement of financial position instead. It uses the same current and non-current split under different labels, so the same steps apply once you've matched the line names.
If you're building a repeatable screening process rather than checking one company, it helps to see how structured ratio fields are defined. Our breakdown of AAOIFI screening methodology and data fields shows how filing inputs get mapped into consistent outputs.
The short video below walks through locating these balance-sheet lines in a live filing.
One last check before calculating. Confirm the units match across every line, because filings often report in thousands or millions. Mixing a numerator in thousands with a denominator in millions produces a ratio that's confidently wrong.
Worked Example Calculating Each Ratio Step by Step
Say you're reviewing a hypothetical company, Northgate Tools Ltd, and its balance sheet reports figures in thousands of US dollars. Treat these numbers as a teaching example, not a real filing.
This is what you pulled from the balance sheet on a single date.
- Cash: $140k
- Marketable securities: $60k
- Trade receivables: $230k
- Inventory: $360k
- Prepaid expenses: $30k
- Total current assets: $820k
- Total current liabilities: $500k
Check the subtotal before you trust it. Add the components yourself: 140 + 60 + 230 + 360 + 30 = 820. It ties to the reported total, so you can proceed.
Running Each Calculation
1. Current ratio
820 ÷ 500 = 1.64
Northgate reports $1.64 of current assets for every $1.00 of current liabilities. On its own, that looks comfortable.
2. Quick ratio
(820 − 360 − 30) ÷ 500 = 430 ÷ 500 = 0.86
You removed inventory because selling it takes time and may require discounts. You also removed prepaid expenses because money already spent on insurance or rent can't be converted back into cash to pay a supplier. What's left is cash, securities, and receivables.
3. Cash ratio
(140 + 60) ÷ 500 = 200 ÷ 500 = 0.40
This is the strictest test. It asks what happens if receivables arrive late and inventory doesn't move at all.
4. Working capital
820 − 500 = $320k
That's the dollar cushion sitting between current assets and current liabilities.
Reading the Spread, Not a Single Number
Don't stop at 1.64. The more useful story is the drop from 1.64 to 0.86 to 0.40.
The quick ratio of 0.86 means cash, securities, and receivables cover 86% of short-term bills. The remaining 14%, roughly $70k in this hypothetical example, depends on converting inventory into cash. That's not automatically a problem, but it tells you exactly where the risk sits.
The cash ratio of 0.40 shows that cash and near-cash cover 40% of obligations immediately. For a tools distributor with steady collections, that may be fine. For a company whose customers pay late, it's a warning.
A quick ratio below 1.0 isn't a verdict. It's an instruction to check receivables collectability and inventory turnover before you conclude anything.
Two habits keep worked examples honest. Round your ratios to two decimals so you're not implying precision the inputs don't support. And keep units consistent across every input, since one line reported in millions among lines in thousands will distort the result far more than any rounding ever will.
Ask one question when you finish. How much of this coverage depends on selling something, and how much is already cash or owed by customers who pay on time? If you can't answer that from your worksheet, you've calculated ratios without understanding them.
Reading Ratios Against Time, Peers and Common Errors
There's no universal pass or fail line for liquidity, and pretending otherwise is the fastest way to misread a healthy company. A grocery chain that turns inventory quickly and collects cash at the till can operate safely with coverage that would alarm you at a manufacturer carrying slow stock and long customer terms. Benchmarks shift by sector and by country, so context does the work that a single threshold can't.
Build that context deliberately. Calculate the current and quick ratios across several years of annual or quarterly balance sheets, plot them, and compare each point with the company's own historical median and with peers in the same industry. A stable ratio slightly below a textbook range usually matters less than a ratio that's deteriorating quarter after quarter.
When a ratio moves noticeably, treat it as a trigger for investigation, not a failure. Decompose the change into its parts. Did cash fall, did receivables climb, did inventory build up, or did short-term debt jump? Each cause points to a different follow-up question, and lumping them together hides the one that matters.
The photo below captures the unglamorous part of this work, comparing periods side by side rather than admiring one snapshot.

Mistakes That Quietly Break the Result
Most bad ratios aren't arithmetic errors. They're input errors, where the division is correct and the numbers fed into it are wrong.
| Mistake | What it does to the ratio | Fix |
|---|---|---|
| Mixing quarterly assets with annual liabilities | Distorts the ratio in either direction | Use the same balance-sheet date for numerator and denominator |
| Subtracting the wrong inventory line | Quick ratio is off by the full inventory error | Use the inventory line on the same balance sheet and date |
| Leaving prepaid expenses in the quick numerator | Quick ratio looks stronger than it is | Remove prepaid expenses before dividing |
| Missing supplier-finance obligations or reclassified debt | Current liabilities are understated | Check footnotes and add the obligations to the denominator |
| Reading one quarter during a seasonal peak | Ratio looks strong or weak for the wrong reason | Compare with the same quarter in prior years |
Seasonality deserves one extra sentence because it fools careful people. A retailer measured just after a holiday inventory build looks different from the same retailer measured after that stock sells through, even though nothing about its underlying health changed.
If you're applying liquidity tests inside a broader compliance screen, the same discipline applies to every ratio in the set. Our guide on what makes a stock Shariah compliant explains how financial ratio thresholds sit alongside business activity checks.
Always report the ratio alongside its numerator and denominator lines. A bare number can't be audited, can't be compared fairly, and can't be corrected when a filing is restated.
Checking a Healthy Ratio Before You Act On It
Neither the current ratio nor the quick ratio proves that obligations will be paid on time. That is the limit you have to respect. Receivables can be overdue or uncollectable, inventory may sell only after heavy discounts, and restricted cash may sit in an account the company cannot use for ordinary bills. A ratio built on those inputs can look comfortable while the actual capacity to pay is far thinner.
Reported current assets can overstate what a company can pay on time when receivables are slow to collect or cash is restricted, and the QuickBooks guide to liquidity ratios covers that distinction between reported ratios and the liquidity a company can truly access. Treat the ratio like a cash-in-the-till count: only the bills that will be collected, and the cash that is free to spend, belong in the picture.
What the Benchmarks Actually Support
Read ratios comparatively instead of hunting for a magic number. The Xero financial statement guide notes that a current ratio above 1.0 means reported current assets exceed current liabilities, and that the commonly cited 1.2 to 2.0 range is only a rough reference rather than a universal standard. Its illustrative case, a current ratio of 1.4 against a quick ratio of 1.1 once inventory is excluded, shows how much inventory dependence can move your assessment.
That gap between the two ratios is the inventory talking. When the gap is wide, ask how fast stock converts to cash and at what discount. When it is narrow, inventory is not the risk, so look at receivables and cash instead.
A Short Sign-Off Routine
Run these checks in order before you rely on any result.
- Confirm the basics. Balance-sheet date and reporting currency match across every line you used.
- Trace the inputs. Numerator and denominator lines match the filing exactly, in the same units.
- Reconcile against reality. Compare both ratios with unrestricted cash, receivables aging, inventory turnover, debt maturities, committed credit lines, and operating cash flow.
- Note the footnotes that change the picture. Restricted cash, obsolescence provisions, and refinancing after the balance-sheet date all belong in your notes.
Step 3 is where weak ratios get caught. Receivables aging shows whether the numerator contains invoices customers have stopped paying. Inventory turnover shows whether stock converts inside the operating cycle or sits. Debt maturities tell you which liabilities come due first, and committed credit lines reveal headroom the ratio itself never shows.
Then decide plainly. A ratio above 1.0 with a stable history, a quick ratio near 1.0, and clean receivables supports the view that short-term obligations are covered. A falling quick ratio alongside rising receivables means you dig deeper, no matter how comfortable the current ratio looks. If liquidity is one test inside a larger screen, our walkthrough on checking whether a company is Shariah compliant shows where it fits.
For teams screening many companies, we compute debt, liquidity, and impure-income ratios from the latest filings in our Financial Ratios (Basic Report) and return them as ready-to-use decimals through the /basic-report endpoint. We update those ratios quarterly from each company's regulatory filings, so the headline liquidity ratio reflects the most recent reported position.
A ratio that cannot be traced to its balance-sheet line items is a screening number, not an analysis.
If you're screening portfolios at scale, Akinda returns those same ratios through the /basic-report endpoint, refreshed quarterly from regulatory filings, so your team spends its time reconciling the exceptions you've learned to spot here rather than extracting figures filing by filing.
Prepared with Outrank app