
You're a few pages into a 10-K, or a broker's research note, or a spreadsheet you built yourself, and two lines on the balance sheet catch your eye. The cash line is big. The debt line is bigger, but not by as much as you'd expect. The obvious question follows: could this company pay off what it owes?
That question has a standard answer in the form of the cash to debt ratio, cash and cash equivalents divided by total debt. It takes thirty seconds to compute and rather longer to interpret properly, because the same number means different things depending on when you measure it, what you put in the denominator, and which screening rulebook you follow. Here's the formula built up from first principles, with each caveat attached to a specific case rather than left as a general warning.
Table of Contents
- What the Cash-to-Debt Ratio Measures
- How to Calculate the Ratio Step by Step
- How It Differs From the Cash Ratio and Cash Flow Coverage
- Reading the Ratio Across Industries and Economic Eras
- How Islamic Screening Treats Cash Differently
- Using a High or Low Ratio Without Overreading It
What the Cash-to-Debt Ratio Measures
Picture a company holding $500 million in cash against $1 billion in total debt. A lender asks the question that matters most: could this business clear its borrowings today? Divide one figure by the other and you get 0.50. That is the cash to debt ratio, a balance-sheet measure of immediate debt coverage set out in the Investing.com ratio guide.
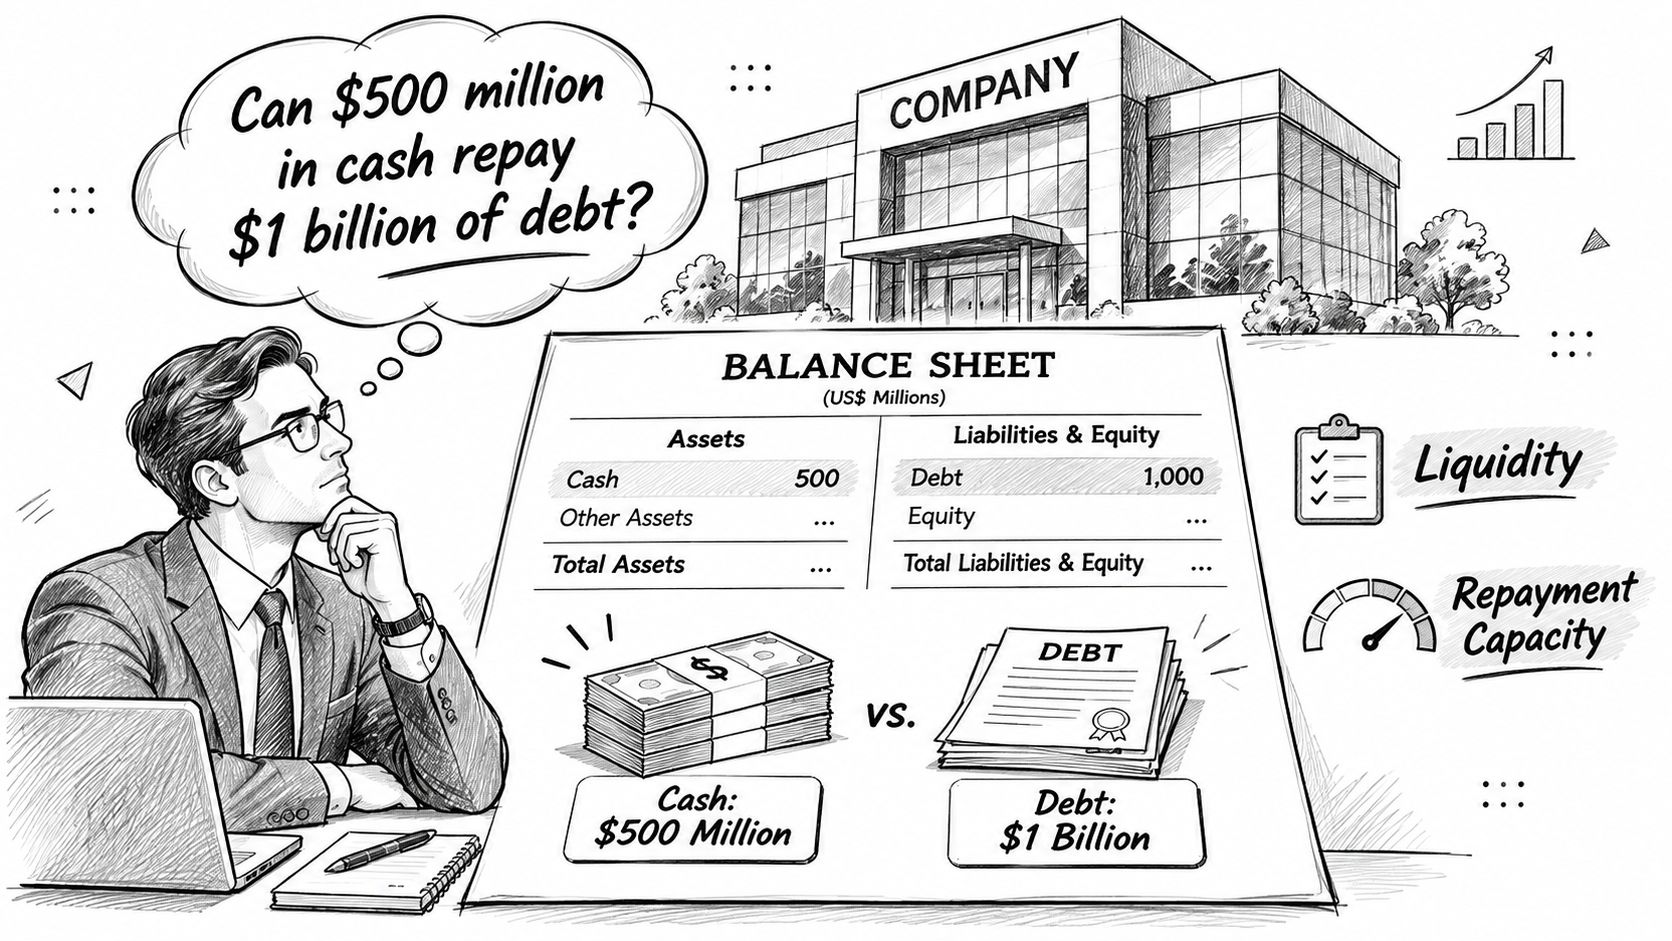
The plain version of the formula is cash and cash equivalents divided by total debt. A broader version adds short-term investments to the numerator, which changes the reading for any company that keeps its surplus in Treasury bills or money market funds rather than in a current account.
Think about your own finances. Add up every loan you've signed: mortgage, car finance, credit cards, student debt. Compare that total with the balance of your savings account, as if all of it came due this afternoon. If your savings covered the lot, you'd score 1.0 or higher. Most households land well below that, and so do most companies, because borrowing exists to fund assets rather than to sit idle as cash.
The denominator matters as much as the numerator. Total debt normally means short-term borrowings plus long-term borrowings, and some methodologies add capital-lease obligations on top. Whichever definition you adopt, keep it fixed, because the ratio moves whenever the definition does.
Reading the result on a 1.0 scale
| Ratio result | What it means | Example from this article |
|---|---|---|
| Above 1.0 | Cash exceeds total debt | $1.5 billion cash against $1 billion debt equals 1.50 |
| Exactly 1.0 | Cash roughly equals total debt | $1 billion cash against $1 billion debt equals 1.0 |
| Below 1.0 | Debt exceeds available cash | $500 million cash against $1 billion debt equals 0.50 |
Back to the opening example. A reading of 0.50 means the company could theoretically cover half its borrowings immediately, before anyone counts operating cash flow, asset sales, refinancing, or restrictions on the cash itself.
What the number is not: a 1.0 reading says cash roughly equals debt on one date. It says nothing about whether the company can keep paying interest next year.
That's the frame to hold. The ratio is a snapshot of balance-sheet liquidity, not proof of repayment capacity, and the awkward parts of that gap deserve their own treatment.
How to Calculate the Ratio Step by Step
The arithmetic takes about four minutes once the filing is open. The sequence matters more than the division, because the numerator and denominator have to come from the same balance-sheet date and use one consistent definition of debt.
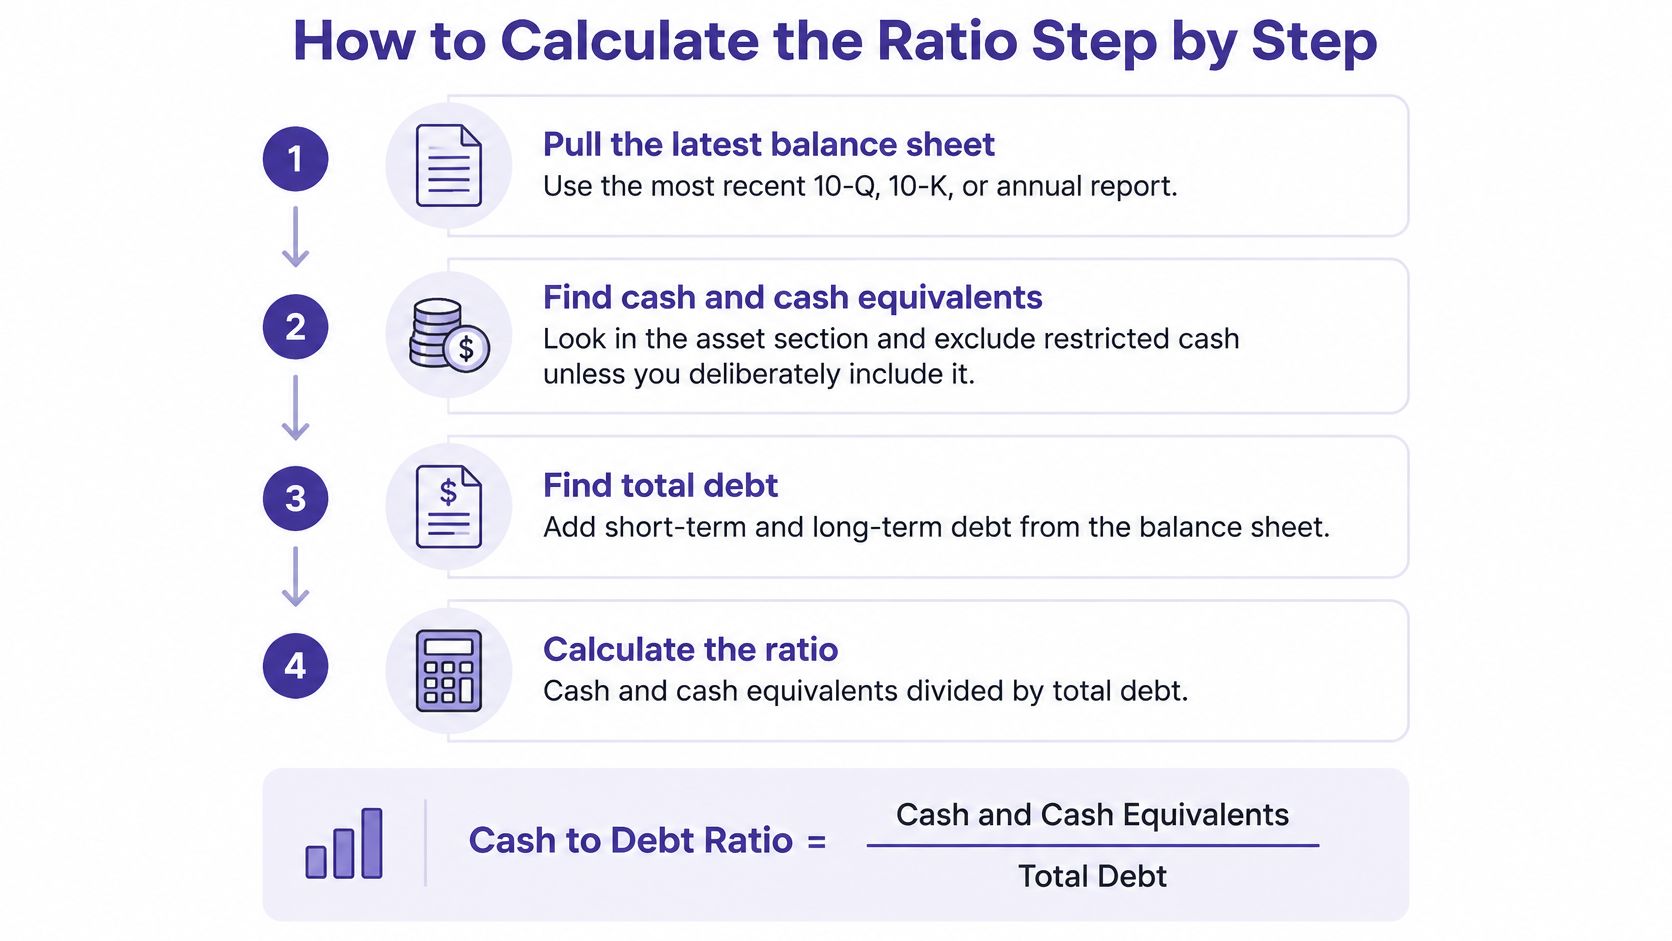
Work through the steps in order and record each choice as you make it, so the number survives a second look from a colleague.
- Pull the most recent balance sheet. Use the latest 10-Q, 10-K or annual report. A quarterly filing beats an annual one here, because it caps how stale the snapshot can be.
- Take cash and cash equivalents from the asset section. Match the line item exactly as labelled. Leave restricted cash out unless you deliberately include it and say why, since cash pledged as collateral or held inside a regulatory ring-fence can't be sent to a lender.
- Decide whether short-term investments join the numerator. Either choice is defensible. Mixing them is not, because a ratio that includes marketable securities can't be compared with one that doesn't.
- Assemble total debt from every borrowing line. Short-term borrowings, the current portion of long-term debt, and long-term debt. Add capital-lease obligations if your method counts them. The usual miss is the current portion, which sits in a separate block from the long-term figure.
- Divide, then express the result both ways. $500 million divided by $1 billion is 0.50, or 50%. Keep the decimal and the percentage in the same record so nobody has to convert later.
- Place the number against 1.0 and against its own history. The benchmark gives scale. The trend gives meaning, because a 0.50 that was 0.45 a year ago reads very differently from one that was 0.90.
- Rebuild prior quarters with the same method. Don't reuse stored figures when a filing has been restated or a debt line reclassified. Recompute from the source, then compare.
Four slips that change the answer
- Total liabilities instead of debt. Accounts payable, pension deficits and deferred tax are obligations, but they aren't borrowings, and including them distorts the ratio in one direction.
- A missing current portion. Long-term debt scheduled to mature inside twelve months still belongs in the denominator.
- Mixed units. Filings report in millions or thousands depending on the company, and a comparison table that mixes both produces nonsense.
- Mismatched dates. Cash from the September quarter divided by debt from the June quarter gives a number with no defensible meaning.
If you'd rather watch the calculation run against a real set of statements, this walkthrough covers the same ground.
Every figure in a published ratio should trace back to one page of one filing, taken on one date. Apply that test before the number leaves your spreadsheet.
How It Differs From the Cash Ratio and Cash Flow Coverage
Three measures answer three separate questions, and swapping one for another is the quickest route to a wrong conclusion.
The cash ratio asks whether this week's bills can be paid from what's already in the fridge. The cash to debt ratio asks whether you could clear every IOU you've ever signed. Cash-flow-to-debt asks how fast your paycheck would retire those IOUs if you stopped spending.
| Ratio | Formula | What it measures | Typical reading |
|---|---|---|---|
| Cash-to-debt | Cash and cash equivalents ÷ total debt | Immediate coverage of all borrowings | 1.0 means cash roughly equals total debt |
| Cash ratio | Cash ÷ current liabilities | Coverage of obligations due within a year | Below 1.0 means cash alone doesn't cover near-term bills |
| Cash-flow-to-debt | Operating cash flow ÷ total debt | Share of debt repayable from one year of operations | About 0.20 to 0.40 for mature non-financial corporates |
Two differences change the conclusion. The denominator is the first: current liabilities versus the whole debt stack, which means the cash ratio ignores the long-dated bonds that determine a company's debt burden. The time frame is the second: one measure reads a balance at a moment, the other reads cash generated across a year.
Work the arithmetic on the second and the scale becomes intuitive. Operating cash flow divided by total debt is commonly read as the share of debt one year of operations could repay, so a reading of 0.25 implies about 25% annual coverage and, if cash generation holds, roughly four years to retire the balance before interest, reinvestment, taxes and distributions. The Umbrex leverage and coverage primer notes that a range of about 0.20 to 0.40 is typical for mature non-financial corporates, though benchmarks shift with business stability and capital needs.
Carry both: a high cash balance sitting next to weak recurring cash generation is a warning, not a comfort. The cash may be temporary, restricted, held overseas, or borrowed a month before the reporting date.
The accounting underneath the numerator deserves attention too, because where cash gets recognised and when revenue hits the statements changes what you're dividing. This explanation of accrual versus cash accounting sets out those mechanics. For the wider family of liquidity measures and where each one fits, our guide to finding the liquidity ratio goes further.
A thin cash buffer is acceptable when operating cash flow is stable and near-term maturities are light. A fat one tells you little until you know what the cash is for.
Reading the Ratio Across Industries and Economic Eras
No single threshold is universally right, because corporate cash and debt levels have shifted enormously over time and differ sharply by sector. Historical context stops a 0.6 from looking alarming when the company has run at 0.6 for a decade.
The long view makes the point. A century-long study of U.S. corporate capital structure found cash holdings reaching nearly 25% of assets in 1945, near the end of World War II, then declining steadily to about 6% by 1970 while debt rose. Because cash fell as borrowing grew, net debt, which is debt minus cash relative to assets, climbed faster than either component alone, as the Morgan Stanley Investment Management study on corporate cash holdings reports.
| Sample and period | Cash as share of assets | Context |
|---|---|---|
| U.S. corporations, 1945 | Nearly 25% | End of World War II |
| U.S. corporations, 1970 | About 6% | Steady decline while leverage rose |
| U.S. public companies, end of 2024 | About 9.0% | Recent level |
| Global sample, average | 12.7% | Average debt was 26.2% of assets |
| Global sample, individual firms | 1% to 50% | Wide spread across firms |
Recent figures sit between those two eras. U.S. public companies held cash equal to approximately 9.0% of total assets at the end of 2024, and a global sample of companies averaged 12.7% of assets in cash against 26.2% in debt. Within that global sample, individual firms' cash-to-assets ratios ranged from 1% to 50% and long-term borrowing ratios from 0.7% to 61%.
Why a utility and a software company can both be healthy
A utility funds pylons and substations with long-dated bonds and collects predictable regulated revenue, so heavy debt against modest cash is a normal structure. A software company with few physical assets and subscription revenue may hold a large cash pile and almost no debt, producing a ratio far above 1.0 without being necessarily safer. Banks and insurers form a third category, where debt is part of the operating model rather than a financing choice.
Crisis conditions add another layer. Firms hoard cash when credit markets tighten, which lifts the ratio for reasons that have nothing to do with improved health.
The comparison that works: measure a company against its sector peers and its own five-year history. A universal threshold misclassifies both the utility and the software firm.
How Islamic Screening Treats Cash Differently
Here's a case that confuses people who know the conventional ratio well. Take a company with $800 million in cash and interest-bearing securities and $600 million in interest-bearing debt. The conventional calculation gives 1.33, so cash comfortably exceeds debt. The same company can still fail a Shariah liquidity screen.
The two tests ask different questions. Conventional analysis asks how much of total debt the cash could cover. AAOIFI-style screening evaluates interest-bearing debt against a market-capitalization denominator, and separately evaluates cash and interest-bearing securities against that same denominator, as this comparison of AAOIFI screening standards sets out.
The denominator is where comparisons break down. Some standards use trailing-average market capitalization, others use total assets, and thresholds commonly sit around 30% to 33%.
Two surprises a single ratio hides
Put numbers on the example. Suppose market capitalization is $2 billion. Debt of $600 million is 30% of market value, sitting right at a typical debt threshold. Cash and securities of $800 million are 40% of market value, well above a 30% liquidity threshold. The company passes on debt and fails on liquidity, even though the conventional ratio showed more cash than borrowings.
Reverse the mix and the opposite happens. A firm with little cash and heavy borrowing can clear the liquidity test while breaching the debt limit. Neither outcome is visible in a single conventional figure.
Name the rulebook before you compare two numbers. A 25% reading means nothing until you know the denominator, the threshold, and whether interest-bearing cash and securities are counted.
The reasoning behind the separate test isn't only about whether cash exists to repay lenders. It also asks whether that cash sits in yield-bearing instruments and whether monetary assets dominate the business. At Akinda, the thresholds we screen against are a debt ratio below 30%, a liquidity ratio below 30% and impure income below 5%.
Methodologies diverge further on short-term investments, operating leases and market-cap volatility, so the same filing produces different numbers under AAOIFI, Dow Jones, FTSE, MSCI and S&P-style rules. Where a disclosure is missing, keep the value null rather than zero, because a zero asserts something the filing never said.
If you're building portfolio screens and want the wider picture of what compliance involves, this guide to Shariah-compliant investing covers the building blocks.
Using a High or Low Ratio Without Overreading It
Two readings go wrong most often. A ratio above 1.0 gets treated as proof of safety, and a ratio below 1.0 gets treated as distress. Both shortcuts fall apart on real balance sheets.
Start with the borrowed-cash trap. Say a company holds $500 million in cash against $1 billion of debt, then issues $1 billion of bonds in the second week of December and closes its financial year two weeks later. The cash lands, debt rises by the same amount, and the ratio moves from 0.50 to 0.75. The business hasn't changed at all. It owes more, and the year-end snapshot flatters it.
An asset sale does something similar, lifting cash without touching debt. So does a seasonal build, which is why retailers look liquid every December. Meanwhile a company with $2 billion maturing inside eighteen months can be riskier than an identical ratio implies.
What the ratio leaves out
- Cash generation. Operating cash flow and free cash flow determine whether the buffer refills or drains away.
- Refinancing access. A borrower with committed credit lines and investment-grade ratings can roll maturities that would sink a smaller rival.
- Interest expense. Cash on the balance sheet doesn't pay coupons; earnings do.
- Maturity timing. Debt due in 2034 and debt due next quarter are not the same obligation, even at the same total.
- Restricted and trapped cash. Balances pledged as collateral or held in a subsidiary with capital controls can't reach the parent's lenders.
Market context sharpens the point. Corporate borrowing from markets reached approximately USD 13.7 trillion in real terms in 2025, the highest level recorded, while corporate cash levels remained above historical averages but below the pandemic-era peak, according to the OECD Global Debt Report. More debt in the system means more companies where a year-end cash snapshot flatters.
The contrarian reading is worth holding onto. A low ratio can sit alongside strong credit quality when recurring free cash flow comfortably services long-dated debt, and a high ratio can mask weak operations.
Six checks before you draw a conclusion
- Trend four to eight quarters. One quarter is a photograph of a moving object.
- Compare with peers and with the company's own history. Use two or three named competitors rather than a market-wide average.
- Divide operating cash flow by total debt. That tells you whether the buffer gets replenished.
- Read the maturity schedule for the next 12 to 24 months. A refinancing wall changes everything the ratio appears to say.
- Inspect restricted cash, operating leases and overseas balances. Cash you can't move isn't coverage.
- Check interest coverage. A company can hold plenty of cash and still struggle to service its coupons.
For a closer look at the denominator and how debt measures relate to one another, this explanation of the debt leverage ratio formula is worth bookmarking.
First-pass screen, not a verdict: the ratio tells you where to look next. It doesn't tell you whether the company will meet its obligations.
Read it that way and it earns its place at the top of your liquidity checklist, as the first question in a longer conversation rather than the last word on solvency.
Akinda's API returns the debt ratio, liquidity ratio and non-compliant revenue share for a stock as ready-to-use decimals, recomputed quarterly from the latest regulatory filings, so your dashboard can show a number alongside the extracted figures behind it. If you're screening halal portfolios or building a research desk tool, you can compare the same company under AAOIFI, Dow Jones, FTSE, MSCI and S&P rules without collecting filings yourself, and keep uncomputed values as null instead of zero. Visit Akinda to see what the basic report returns for a ticker you already follow.