
The most popular advice about financial dashboard software is to choose the platform with the best charts and the longest connector list. That's a poor starting point. A dashboard that looks finished with clean source files can break when another feed arrives with different date formats, a missing reporting currency, or a refresh schedule nobody documented.
The harder questions concern what happens behind the screen. Can an analyst trace a ratio to its source? Can a reviewer reproduce an earlier report? Will an embedded dashboard enforce the same customer permissions as the application around it?
Adoption alone doesn't answer those questions. Gartner-reported findings cited by IBM put average employee usage of analytics and business-intelligence tools at 29%, despite adoption increasing in 87% of surveyed organizations. Buying access and building a useful workflow aren't the same thing.
Practical rule: Test the awkward dataset and the restricted user account before judging the polished dashboard.
The tools below are assessed on data connectivity, visualization, reporting, customization, and collaboration. Their intended jobs matter more than a feature count:
- General BI: Power BI, Tableau, Zoho Analytics, and Qlik Cloud Analytics support broad analytical workflows.
- Embedded analytics: Metabase and Sisense deserve attention when analytics belongs inside your application.
- Data-stack-dependent platforms: Looker emphasizes governed models, while Domo combines integration and operational analytics.
- Finance-reporting platforms: Fathom and Spotlight Reporting focus on business accounts, forecasting, and management reports.
These categories overlap. None should be mistaken for a ready-made investment-research or Shariah-screening engine.
Table of Contents
- 1. Microsoft Power BI
- 2. Tableau
- 3. Zoho Analytics
- 4. Google Looker
- 5. Metabase
- 6. Sisense
- 7. Qlik Cloud Analytics
- 8. Domo
- 9. Fathom
- 10. Spotlight Reporting
- How the 10 financial dashboard software options compare on fit, pricing visibility, and embedding
- Matching a Dashboard Tool to Your Data and Your Team
1. Microsoft Power BI
Best fit for Microsoft-centered teams building internal research and portfolio dashboards.
Microsoft Power BI combines data preparation, semantic modeling, interactive reports, and distribution. It's a practical shortlist candidate when analysts already work in Excel and the organization uses Microsoft infrastructure. Familiar surroundings help, but they don't remove the need for a reliable model.
Data connectivity is a strength: spreadsheets, databases, and business applications can feed a shared analytical layer. Power Query handles preparation, while DAX supports calculated measures. The difficult work is deciding which transformations belong upstream and which belong in the report model.
For visualization, filters and drill-downs suit portfolio summaries, sector comparisons, and screening-review queues. Reporting needs separate evaluation: an interactive analyst view and a fixed management pack have different layout and distribution requirements.
Where implementation gets demanding
- Customization: DAX offers flexibility, but calculation context takes time to master. Test totals, missing periods, and changing portfolio constituents rather than validating only individual rows.
- Collaboration: Role-based access and sharing depend on the deployment and licensing arrangement. Include external reviewers and embedded users in the design before committing.
- Maintenance: Assign ownership of the semantic model. Otherwise, analysts can create competing definitions of the same financial measure.
For filing-backed research, the SEC filings API integration approach is relevant to the upstream evidence pipeline. Keep source identifiers and reporting periods alongside imported figures.
The trade-off: Power BI provides a flexible analytical interface, not a supplied investment methodology. Screening rules, evidence retention, and verdict explanations still need an authoritative upstream service or a maintained internal implementation.
2. Tableau
Choose Tableau when analysts need to explore relationships visually, not merely publish a standard financial summary. A research desk comparing sector exposure, liquidity measures, and screening outcomes can benefit from an interface that lets users change the analytical question without rebuilding the entire dashboard.
Its data connectivity covers varied databases, files, and cloud sources. That breadth is useful, but joining datasets still requires explicit decisions about identifiers, dates, and granularity. A company-level financial measure shouldn't multiply because it was joined directly to position-level records.
Visualization is the main reason to shortlist Tableau. Interactive charts and filters support exploratory work, while reporting requires attention to what survives outside the interactive interface. An exported chart must retain enough context to explain its filters, measurement period, and currency.
Strong exploration needs disciplined authorship
Customization through developer options, extensions, and embedding can support a research portal. Treat those capabilities as implementation choices, not proof that every interaction will fit your application without engineering.
Collaboration depends on how authors publish, reviewers consume, and administrators govern shared content. Separate experimental workbooks from approved research views so a useful exploratory calculation doesn't become an institutional metric.
A chart that makes an exception obvious is useful. A chart that hides the exception's definition is not.
Tableau's trade-off is ownership. It suits teams willing to maintain analytical models and visual standards, but it's less attractive when occasional users must assemble dependable reports without specialist support. Validate licensing and embedded deployment requirements against the actual audience.
3. Zoho Analytics
Zoho Analytics makes sense when a small team needs business-finance reporting without immediately building a substantial analytics stack.
Zoho Analytics combines self-service dashboards, reporting, financial-app connectors, and API-based integration. Its connections to accounting and payment applications make it relevant to operating-finance dashboards. Custom investment datasets require a separate ingestion and modeling design.
Consider a fintech startup monitoring subscription revenue alongside portfolio-service operations. Bringing those business measures together is a different job from calculating whether the underlying securities pass a screening methodology.
- Data connectivity: Accounting-app integrations can reduce routine imports. For custom feeds, test authentication, incremental updates, schema changes, and how failed imports are surfaced.
- Visualization: Drag-and-drop reports suit recurring operational questions. Check whether the available chart interactions support your review process rather than choosing by appearance.
- Reporting: Build the actual scheduled report during evaluation, including filters and export formatting. A dashboard preview doesn't establish that distribution works as required.
Accessible authoring, bounded by the plan
Customization includes imported datasets, APIs, and eligible embedding options. The practical limit is often the combination of stored data, user access, and required platform features, not whether a chart can be drawn.
For collaboration, distinguish internal colleagues from customers accessing an embedded product. Confirm the permissions, branding, and governance included in the intended plan.
I'd shortlist Zoho Analytics for a lean team combining finance-app data with straightforward custom analysis. I wouldn't select it on the assumption that a finance connector supplies securities research, portfolio accounting, or compliance logic. Those are separate responsibilities, even when their outputs appear on the same dashboard.
4. Google Looker
When different teams calculate the same metric differently, another visualization tool won't solve the underlying problem. Google Looker is worth considering because its LookML modeling layer emphasizes reusable definitions rather than independent dashboard calculations.
This is a data-stack-dependent choice. A data team needs to own the models and the infrastructure beneath them. It's a stronger fit for an established analytical environment than for a founder trying to connect a spreadsheet and publish a report immediately.
Judge the model before the dashboard
For data connectivity, evaluate how your existing analytical database supports the intended queries. Include historical comparisons and detailed drill-through, not just summary cards.
Visualization and self-service exploration become more useful when users work from governed definitions. For investment research, define whether a denominator uses a current value, an average, or a filing-period value before exposing the measure.
Reporting should preserve that context in scheduled outputs and exports. A centrally defined metric is still easy to misunderstand when a report omits its methodology or effective date.
- Customization: LookML supports reusable modeling, and the Embed edition targets analytics within applications. Include model maintenance in the engineering estimate.
- Collaboration: Shared definitions help analysts and reviewers discuss the same measure. Changes still need review, testing, and a clear owner.
The trade-off is technical dependence. Looker can reduce duplicated metric definitions, but finance users may depend on model maintainers for changes. It's excessive if the reporting problem is simple and nobody will maintain the semantic layer.
For a multi-team research operation, that maintenance burden may be justified. For an early prototype, it may delay learning what users need.
5. Metabase
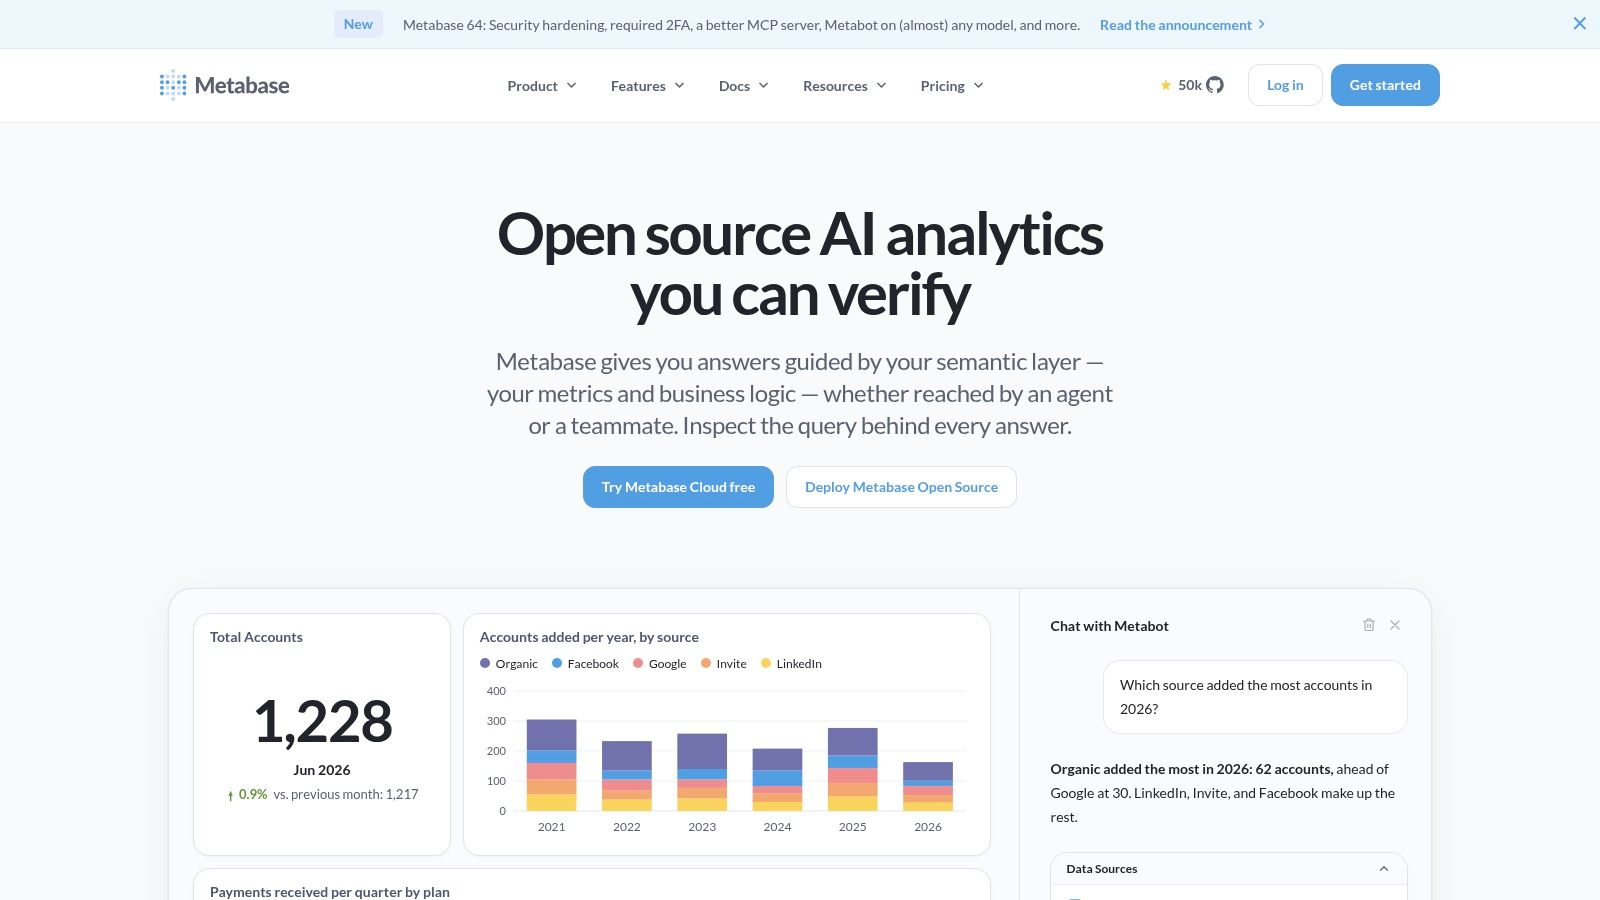
A developer-led team with a working database should consider Metabase before building every chart and filter itself. Its visual query builder and SQL workflows support internal exploration, while embedding options make it relevant to application reporting.
The open-source self-hosted option changes the buying decision, but it doesn't eliminate operating responsibility. Your team still owns infrastructure, upgrades, backups, and security operations.
Data connectivity works best as a database-design question: can the application expose clean, appropriately scoped analytical tables or views? Don't point a dashboard at a confusing transactional schema and expect nontechnical users to infer the correct joins.
Visualization is suitable for straightforward analytical questions. For reporting, test the exact delivery path and make sure recipients understand whether an output reflects current data or a historical snapshot.
Embedding requires permission design
- Customization: SQL and embedding provide useful control, but the available branding and integration options depend on the edition and embedding method.
- Collaboration: Let analysts explore approved datasets without giving every user unrestricted database access.
- Customer isolation: Validate tenant permissions independently of visible filters. Hiding a customer selector isn't an access-control strategy.
Metabase is a sensible fit when the database already contains trustworthy screening outputs and the team wants a usable research interface quickly. It's less suitable as a substitute for missing data engineering.
The important boundary is querying versus calculating authoritative compliance results. A dashboard can display a verdict and its inputs. Your application still needs a controlled process for producing, updating, and explaining that verdict.
6. Sisense
Sisense belongs on the shortlist when analytics is part of the product, not a separate destination for employees. Sisense emphasizes embedded analytics, developer integration, and enterprise deployment choices.
For a broker or robo-advisor, the important question isn't whether a dashboard can appear inside a page. It's whether users retain the right identity, permissions, navigation, and context throughout the analytical workflow.
Data connectivity includes databases, warehouses, and cloud applications. Test the path from an upstream update to the customer-facing result, including failures and delayed refreshes.
Visualization should be evaluated inside your application shell. Check responsiveness, filter behavior, and how users move from a portfolio summary to the supporting security-level evidence.
Test the application boundary
For reporting, establish whether customers need interactive views, downloadable evidence, or scheduled outputs. These are distinct product requirements and shouldn't be bundled into a vague request for dashboards.
Customization is a reason to investigate Sisense's developer tooling. It also introduces work: authentication integration, styling, release testing, and operational monitoring need named owners.
Collaboration requires particular care in multi-tenant products. Internal support staff, customer administrators, and end users may need different permissions even when they view related data.
Deployment test: Attempt to access another tenant's records through exports, drill-through, and modified requests, not just through the visible dashboard.
The trade-off is implementation scope. Enterprise deployment options may suit demanding infrastructure requirements, but they don't remove engineering effort. Validate tenant isolation, expected query behavior, and commercial terms before treating embedding as a finished capability.
7. Qlik Cloud Analytics
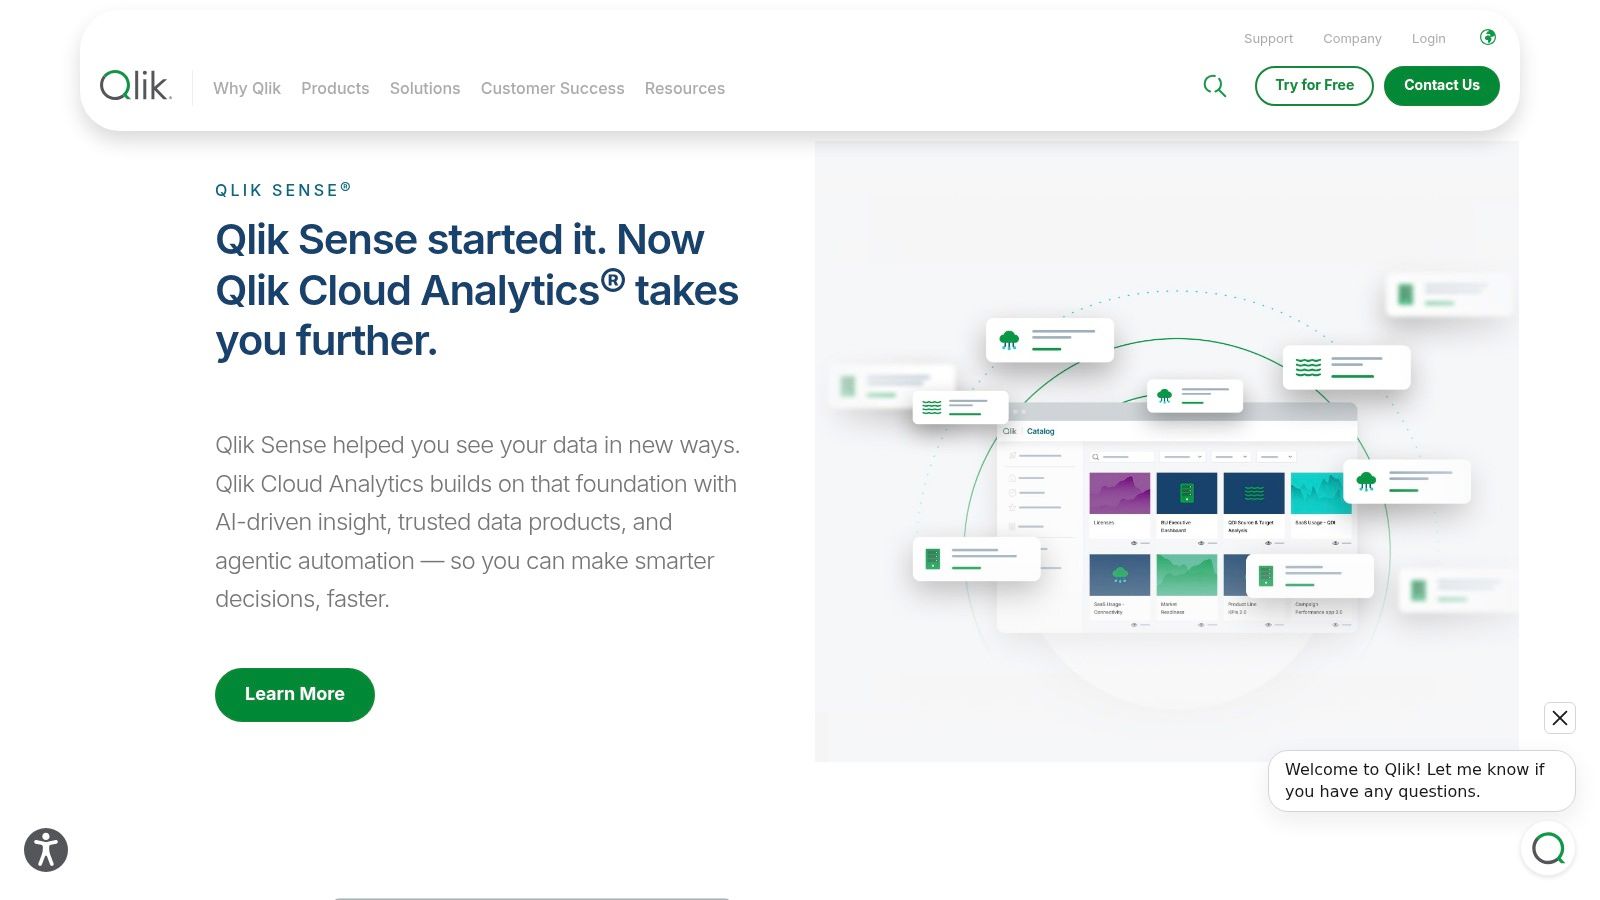
An analyst investigating an unexpected exposure often needs to follow relationships across holdings, issuers, sectors, and financial inputs. Qlik Cloud Analytics is relevant to that work because of its associative exploration approach, alongside dashboarding and data-integration capabilities.
It fits the general BI category, particularly where a dedicated analytical team will maintain the environment. Its breadth is useful when users investigate changing questions, but it can be unnecessary for a fixed monthly reporting pack.
Evaluate exploration with a real exception
Start with a scenario: a portfolio's flagged exposure changes, and the analyst must identify the responsible holdings. Have the evaluator follow selections across the relevant datasets, then explain which records are excluded.
- Data connectivity: Confirm that integration preserves issuer identifiers, reporting currencies, and effective dates across sources.
- Visualization: Test whether selections make relationships easier to understand without encouraging users to confuse correlation with a screening rule.
- Reporting: Ensure exported summaries retain the selections and definitions needed to interpret them.
For customization, APIs and embedded analytics can extend the interface into other workflows. That flexibility still requires consistent calculation ownership.
For collaboration, publish approved analytical views separately from experimental work. Occasional reviewers need clear starting points, not an unrestricted exploration surface with unexplained measures.
Qlik is worth considering when relationship discovery is a recurring analytical task. It's not a ready-made investment-compliance system. Predictive or what-if capabilities elsewhere in the platform don't establish whether a security satisfies a particular methodology, and modeled scenarios should remain distinguishable from reported financial inputs.
8. Domo
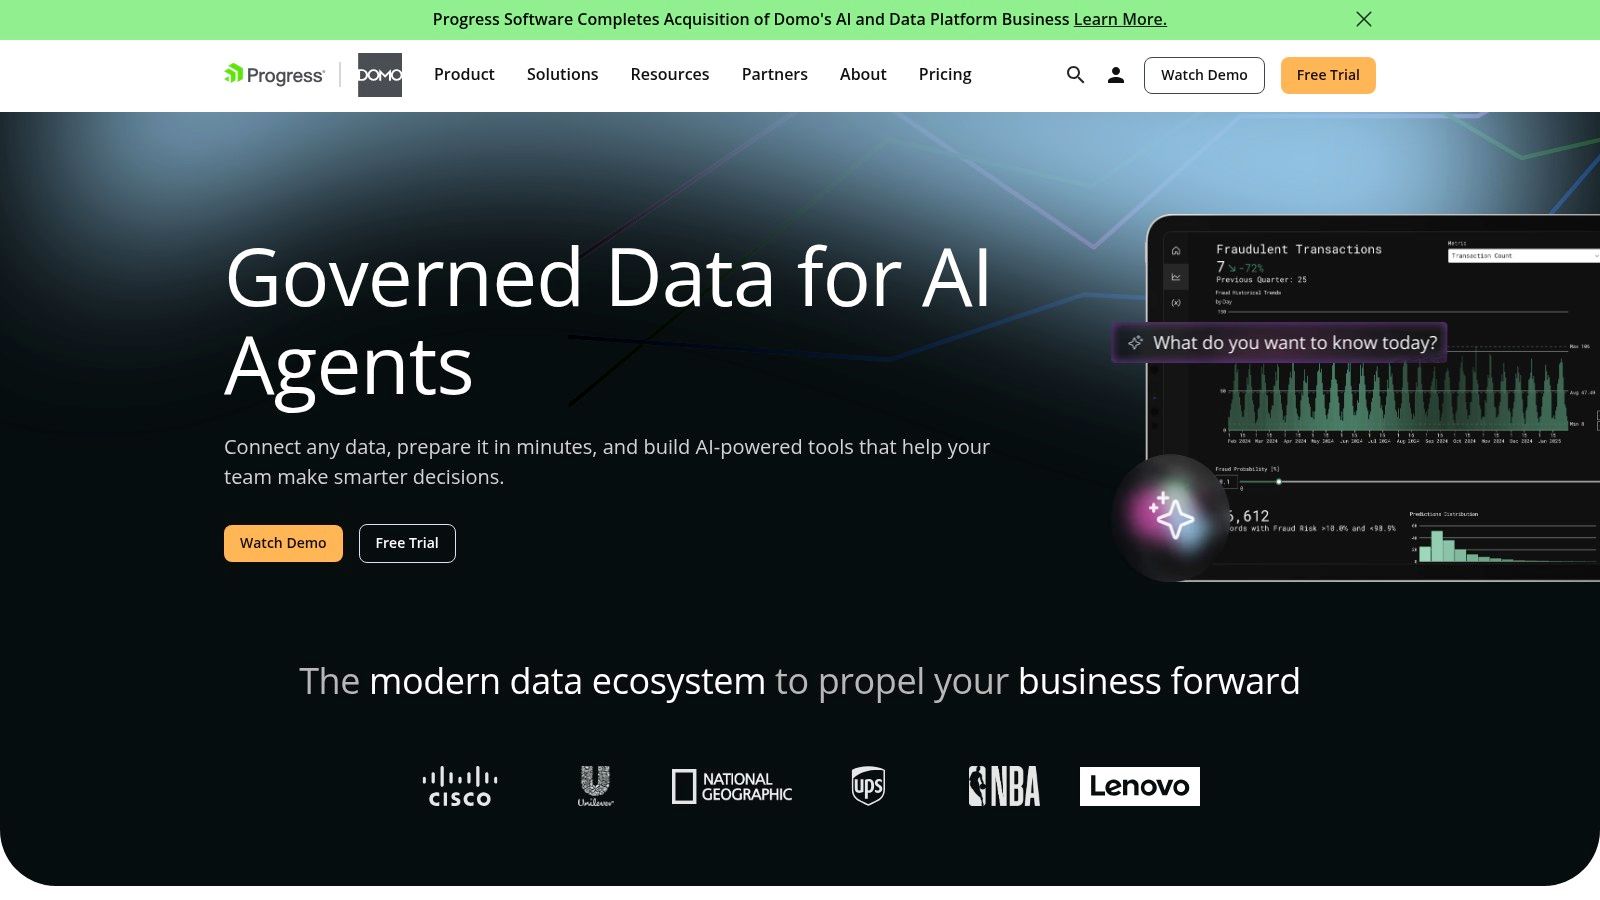
Domo suits organizations trying to combine data integration, preparation, operational dashboards, and distribution in a shared platform. That makes it different from a lightweight visualization layer placed over an already finished warehouse.
For a fintech operator, the attraction is practical: business operations, customer activity, and research-service outputs can appear in related views. The risk is purchasing a broader platform than the reporting problem requires.
Data connectivity should be tested for connector behavior, not just availability. Check incremental loading, deleted records, failed refreshes, and schema changes. A connector that authenticates successfully hasn't yet proved that the resulting financial dataset reconciles.
Visualization supports operational monitoring, while reporting includes distribution paths such as alerts, scheduled reports, and exports. Alerts need an accountable recipient and enough context to support action.
Budget for the pipeline, not just the page
Customization includes transformation workflows, embedding, and app-building options. Decide whether business logic belongs in those transformations or in a separately maintained data service.
Collaboration should cover dataset ownership as well as dashboard access. A shared screen is unreliable if nobody knows who approves changes to its underlying transformation.
For teams selecting an upstream screening feed, a halal stock API comparison addresses a separate decision from choosing the presentation platform.
Domo's consumption-based commercial structure makes workload modeling important. Include refreshes, transformations, ordinary dashboard use, and embedded access in the evaluation.
The trade-off is consolidation versus scope. Combining preparation and presentation can simplify operations, but only if the team can govern the resulting pipelines and understand their ongoing consumption.
9. Fathom
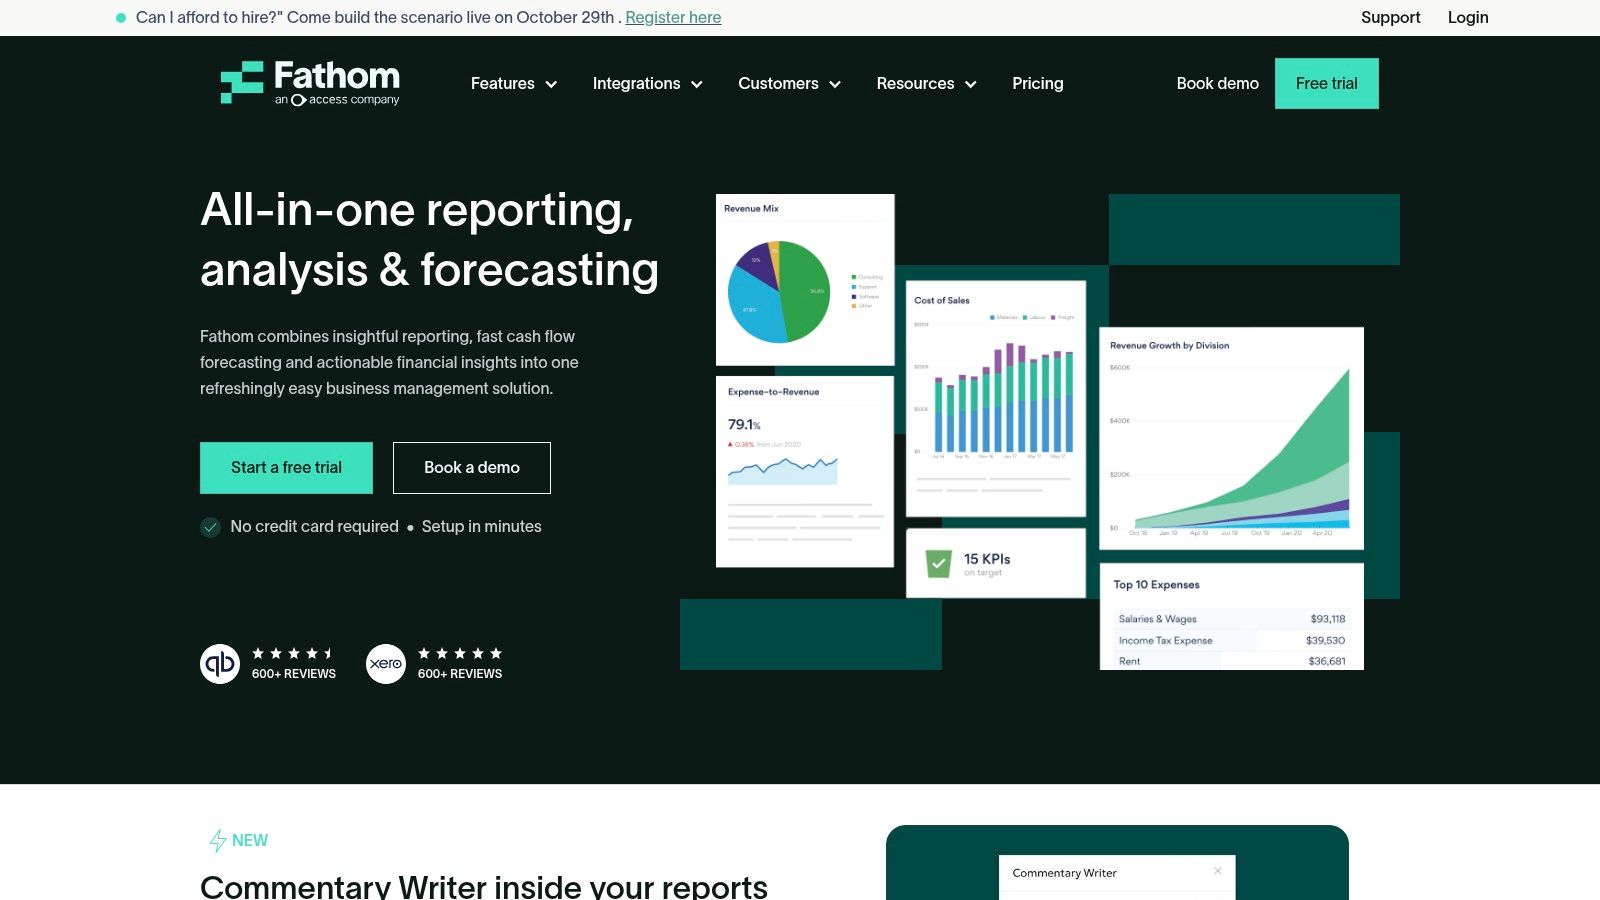
A finance lead preparing management accounts has a different problem from an analyst researching listed securities. Fathom is built for the former: financial reporting, business-performance analysis, forecasting, and consolidation.
That purpose-built focus can be an advantage. You don't necessarily want a general BI modeling project when the required output is a financial performance pack and a cash-flow discussion.
For data connectivity, accounting integrations and spreadsheet imports align with business-finance workflows. Validate the chart-of-accounts mapping, period treatment, and currency handling before trusting consolidated results.
Visualization centers on financial performance and KPIs rather than unrestricted market-data exploration. Reporting is the main attraction when accountants or finance teams need recurring management outputs.
A better fit for company accounts than security screening
- Customization: Configure metrics, forecasts, and scenarios around the business. Don't assume those controls provide an arbitrary investment-research application builder.
- Collaboration: Evaluate how preparers and reviewers exchange the final report and supporting explanations.
- Planning: Keep scenario assumptions visibly separate from actual results so reviewers can distinguish a forecast from recorded performance.
The main limitation is categorical, not cosmetic. A business-finance platform shouldn't be selected merely because both accounting reports and portfolio dashboards contain ratios.
Fathom may suit the finance operations of an investment startup while another system supports its customer-facing research. Trying to force both jobs into the same interface can increase spreadsheet imports and manual reconciliation.
I'd shortlist it for management reporting and forecasting. I wouldn't use it as the foundation for holdings-based fund screening or methodology comparisons.
10. Spotlight Reporting
Spotlight Reporting is a finance-reporting choice, not a general investment-data platform. Spotlight Reporting focuses on management reports, dashboards, forecasting, and group reporting for finance teams, accountants, and advisors.
Its structured approach is relevant when a preparer needs to explain business performance to someone who won't explore an analytical database. A consistent report can be more useful than a highly configurable dashboard that requires training.
Assess the complete reporting pack
For data connectivity, accounting integrations should be tested against the actual entities and reporting periods involved. Confirm which required sources fit the supported workflow and which would need additional preparation.
Visualization emphasizes financial charts and scorecards. For reporting, assess the finished pack: narrative context, period comparisons, group presentation, and how clearly the reader can distinguish actuals from forecasts.
Customization should be judged against the reporting job. Structured layouts can reduce preparation work, but a highly specific research interface may sit outside the product's intended scope.
Collaboration means more than sending a document. Establish who prepares the figures, who reviews the commentary, and how the approved version is identified.
The boundary matters for financial institutions. Operational management reporting and Shariah screening for robo-advisors and brokerages require different inputs and review processes.
Choose Spotlight Reporting when financial communication is the primary requirement. For security-level compliance analysis, keep the screening service and its evidence upstream, then choose a suitable research or embedded interface for those outputs. Don't stretch accounting-oriented reporting into an investment classification system just to avoid maintaining separate workflows.
How the 10 financial dashboard software options compare on fit, pricing visibility, and embedding
Read this table by what each product was built to do. General BI and data-stack tools dominate the list, while the last two rows are finance-reporting platforms with a narrower job.
| Item | Best for | Pricing visibility | Embedded analytics |
|---|---|---|---|
| Microsoft Power BI | Internal dashboards and prototypes using business data | Low-cost entry point; licensing varies | Available, subject to licensing and implementation |
| Tableau | Visual analytics and exploratory dashboards | Listed user rates; embedding may have separate pricing | Available for custom portals and products |
| Zoho Analytics | Self-service reporting and finance-app dashboards | Public pricing and free tier | Available on eligible paid plans |
| Google Looker | Governed analytics for data teams | Custom quote; no public list prices | Dedicated Embed edition available |
| Metabase | Developer-led teams adding data reporting to applications | Open-source option; paid plans available | Options available; advanced features are paid |
| Sisense | Product teams embedding analytics in applications | Quote-based | Core product use case with developer tools |
| Qlik Cloud Analytics | Data exploration across multiple sources | Usage- or subscription-based; confirm with Qlik | Available through embedded analytics and APIs |
| Domo | Operational dashboards combining data from business systems | Credit-based; request a detailed quote | Embedding and app-building features available |
| Fathom | Business financial reporting and forecasting | Public pricing and a free trial | Not a featured capability; focused on internal finance reporting |
| Spotlight Reporting | Finance teams and advisors preparing client reports | Public US pricing for some plans | Not a featured capability; oriented toward client-facing report packs |
Pricing visibility splits the list cleanly. Zoho and the finance-reporting tools publish rates, so you can shortlist them without a sales call, while Sisense, Domo, Looker and Qlik require quotes before you can model cost. Embedding follows the same pattern: it is a core use case for the BI and product-analytics tools and largely absent from Fathom and Spotlight Reporting, which package output as finished reports instead. Neither group performs investment or compliance classification on its own, so budget for that logic upstream regardless of which row you pick.
Matching a Dashboard Tool to Your Data and Your Team
Choose financial dashboard software by the work your team must complete, not by the most impressive demonstration. General BI suits broad research and internal analysis. Embedded platforms deserve attention when customers need analytics within your product, while finance-reporting platforms fit management accounts and forecasts.
Before committing, run your own source files and API responses through the shortlisted tools. Reconcile the output against the originals, including reporting currencies, duplicate identifiers, revised filings, and missing values. Then produce a real report end to end, including refresh, filtering, export, and reviewer access.
A financial-services governance report from Strategy identifies fragmented data, inconsistent metrics, integration complexity, and governance gaps as barriers to scaling analytics. Translate those concerns into acceptance criteria rather than another procurement questionnaire.
Require evidence behind the number
- Provenance: Keep source-document references, reporting periods, and calculation definitions accessible from the displayed measure.
- Reproducibility: Preserve the inputs and methodology version needed to explain an earlier report after the underlying data changes.
- Freshness: Distinguish the filing date, ingestion time, calculation time, and dashboard refresh time.
- Permissions: Test ordinary users, reviewers, administrators, and embedded customers independently.
For investment and compliance applications, uncertainty deserves equal attention. The World Economic Forum's financial-services AI guidance emphasizes transparency alongside privacy, cybersecurity, and policy concerns. In a dashboard, that means making incomplete coverage and unavailable calculations visible rather than presenting every instrument as conclusively classified.
Null isn't zero, and unrated isn't non-compliant. For a fund, show whether the result comes from its underlying holdings, how much of the portfolio is covered, and which methodology applies. Where standards differ, present the applicable rules rather than merging classifications.
Keep screening logic separate from presentation
If you use our screening data at Akinda, basic financial ratios arrive as ready-to-use decimals. Format them for display without accidentally changing their scale, and retain the reporting currency and underlying period alongside the result.
We refresh financial ratios quarterly from company regulatory filings. A dashboard refresh doesn't make those filing-derived inputs newly reported financial information. Our screening results are informational, based on reported financial data, and don't replace a qualified scholar.
The final purchase decision should include operating ownership. Name the people responsible for connectors, metric definitions, access reviews, and failed updates. Choose the platform your team can maintain and defend, not the one with the longest feature list.
Akinda provides a REST API for Shariah screening of stocks and ETFs, with financial ratios, verdicts, and supporting report data for dashboard integration. Visit Akinda to explore the documentation and request playground, then test the screening outputs alongside your shortlisted dashboard tools.